
Page 205 - Read Online
P. 205
Page 8 of 13 Tang. Mini-invasive Surg 2020;4:24 I http://dx.doi.org/10.20517/2574-1225.2019.60
A B
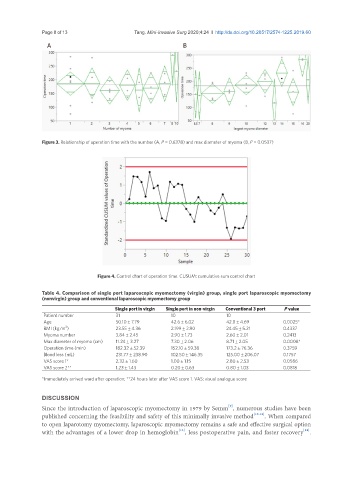
Figure 3. Relationship of operation time with the number (A, P = 0.6378) and max diameter of myoma (B, P = 0.0537)
Figure 4. Control chart of operation time. CUSUM: cumulative sum control chart
Table 4. Comparison of single port laparoscopic myomectomy (virgin) group, single port laparoscopic myomectomy
(nonvirgin) group and conventional laparoscopic myomectomy group
Single port in virgin Single port in non-virgin Conventional 3 port P value
Patient number 31 10 10
Age 50.10 ± 7.79 42.6 ± 6.02 42.8 ± 4.69 0.0025*
2
BMI (kg/m ) 23.55 ± 4.36 2.199 ± 2.90 24.45 ± 5.21 0.4337
Myoma number 3.84 ± 2.45 2.90 ± 1.73 2.60 ± 2.01 0.2413
Max diameter of myoma (cm) 11.24 ± 3.27 7.30 ± 2.06 8.71 ± 2.05 0.0008*
Operation time (min) 182.32 ± 52.39 152.10 ± 59.38 173.2 ± 76.36 0.3759
Blood loss (mL) 231.77 ± 238.90 102.50 ± 146.35 125.00 ± 206.07 0.1757
VAS score 1* 2.32 ± 1.60 1.00 ± 1.15 2.80 ± 2.53 0.0586
VAS score 2** 1.23 ± 1.43 0.20 ± 0.63 0.80 ± 1.03 0.0818
*Immediately arrived ward after operation; **24 hours later after VAS score 1. VAS: visual analogue score
DISCUSSION
[9]
Since the introduction of laparoscopic myomectomy in 1979 by Semm , numerous studies have been
published concerning the feasibility and safety of this minimally invasive method [10-12] . When compared
to open laparotomy myomectomy, laparoscopic myomectomy remains a safe and effective surgical option
[14]
[13]
with the advantages of a lower drop in hemoglobin , less postoperative pain, and faster recovery .