
Page 201 - Read Online
P. 201
Page 4 of 13 Tang. Mini-invasive Surg 2020;4:24 I http://dx.doi.org/10.20517/2574-1225.2019.60
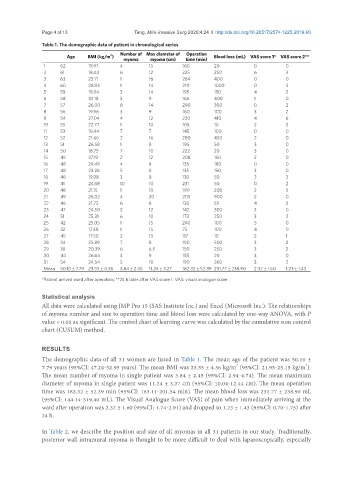
Table 1. The demographic data of patient in chronological series
2
Age BMI (kg/m ) Number of Max diameter of Operation Blood loss (mL) VAS score 1* VAS score 2**
myoma myoma (cm) time (min)
1 62 19.97 4 15 160 20 0 0
2 61 18.44 6 12 225 250 6 3
3 63 23.71 1 16 284 400 0 0
4 60 28.93 1 14 210 1000 0 3
5 59 19.94 3 14 195 150 4 2
6 58 32.18 3 9 165 400 1 0
7 57 26.00 8 14 290 300 0 2
8 56 19.96 3 9 160 100 3 2
9 54 27.04 4 12 220 410 4 6
10 55 22.77 1 10 105 10 2 2
11 53 18.44 7 7 145 100 0 0
12 52 21.66 2 16 280 450 2 0
13 51 26.58 1 8 195 50 3 0
14 50 18.75 7 10 222 20 3 0
15 49 37.19 2 12 208 150 2 0
16 48 24.49 4 8 135 180 0 0
17 48 23.28 5 8 135 150 3 0
18 46 19.98 3 8 130 50 2 2
19 41 24.68 10 10 231 50 0 2
20 48 21.15 1 10 190 200 2 3
21 49 26.02 4 20 205 900 2 0
22 46 21.72 6 8 130 55 4 2
23 47 24.50 2 12 142 300 3 0
24 51 25.31 6 10 173 250 3 2
25 42 25.05 1 15 240 100 5 0
26 32 17.48 1 15 75 100 4 0
27 45 17.50 2 13 117 10 2 1
28 34 25.89 7 8 190 500 3 2
29 38 20.39 6 6.5 150 250 3 2
30 44 26.64 3 9 155 20 3 0
31 54 24.54 5 10 190 260 3 2
Mean 50.10 ± 7.79 23.55 ± 4.36 3.84 ± 2.45 11.24 ± 3.27 182.32 ± 52.39 231.77 ± 238.90 2.32 ± 1.60 1.23 ± 1.43
*Patient arrived ward after operation; **24 h later after VAS score 1. VAS: visual analogue score
Statistical analysis
All data were calculated using JMP Pro 15 (SAS Institute Inc.) and Excel (Microsoft Inc.). The relationships
of myoma number and size to operation time and blood loss were calculated by one-way ANOVA, with P
value < 0.05 as significant. The control chart of learning curve was calculated by the cumulative sum control
chart (CUSUM) method.
RESULTS
The demographic data of all 31 women are listed in Table 1. The mean age of the patient was 50.10 ±
2
2
7.79 years (95%CI: 47.24-52.95 years). The mean BMI was 23.55 ± 4.36 kg/m (95%CI: 21.95-25.15 kg/m ).
The mean number of myoma in single patient was 3.84 ± 2.45 (95%CI: 2.94-4.74). The mean maximum
diameter of myoma in single patient was 11.24 ± 3.27 cm (95%CI: 10.04-12.44 cm). The mean operation
time was 182.32 ± 52.39 min (95%CI: 163.11-201.54 min). The mean blood loss was 231.77 ± 238.90 mL
(95%CI: 144.14-319.40 mL). The Visual Analogue Score (VAS) of pain when immediately arriving at the
ward after operation was 2.32 ± 1.60 (95%CI: 1.74-2.91) and dropped to 1.23 ± 1.43 (95%CI: 0.70-1.75) after
24 h.
In Table 2, we describe the position and size of all myomas in all 31 patients in our study. Traditionally,
posterior wall intramural myoma is thought to be more difficult to deal with laparoscopically, especially