
Page 204 - Read Online
P. 204
Tang. Mini-invasive Surg 2020;4:24 I http://dx.doi.org/10.20517/2574-1225.2019.60 Page 7 of 13
A B
C D
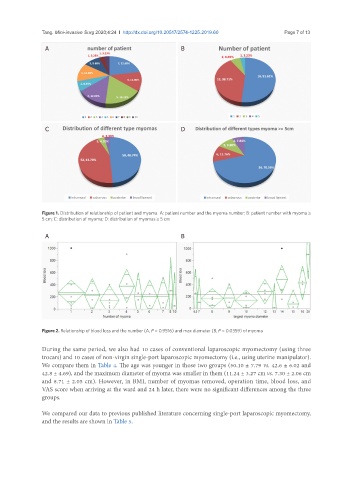
Figure 1. Distribution of relationship of patient and myoma. A: patient number and the myoma number; B: patient number with myoma ≥
5 cm; C: distribution of myoma; D: distribution of myomas ≥ 5 cm
A B
Figure 2. Relationship of blood loss and the number (A, P = 0.9516) and max diameter (B, P = 0.0359) of myoma
During the same period, we also had 10 cases of conventional laparoscopic myomectomy (using three
trocars) and 10 cases of non-virgin single-port laparoscopic myomectomy (i.e., using uterine manipulator).
We compare them in Table 4. The age was younger in those two groups (50.10 ± 7.79 vs. 42.6 ± 6.02 and
42.8 ± 4.69), and the maximum diameter of myoma was smaller in them (11.24 ± 3.27 cm vs. 7.30 ± 2.06 cm
and 8.71 ± 2.05 cm). However, in BMI, number of myomas removed, operation time, blood loss, and
VAS score when arriving at the ward and 24 h later, there were no significant differences among the three
groups.
We compared our data to previous published literature concerning single-port laparoscopic myomectomy,
and the results are shown in Table 5.