
Page 25 - Read Online
P. 25
Page 232 Puyana et al. J Transl Genet Genom 2022;6:223-239 https://dx.doi.org/10.20517/jtgg.2021.51
2
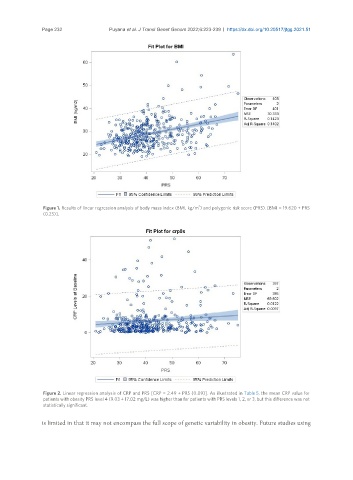
Figure 1. Results of linear regression analysis of body mass index (BMI, kg/m ) and polygenic risk score (PRS). [BMI = 19.620 + PRS
(0.23)].
Figure 2. Linear regression analysis of CRP and PRS [CRP = 2.49 + PRS (0.09)]. As illustrated in Table 5, the mean CRP value for
patients with obesity PRS level 4 (9.03 ± 17.02 mg/L) was higher than for patients with PRS levels 1, 2, or 3, but this difference was not
statistically significant.
is limited in that it may not encompass the full scope of genetic variability in obesity. Future studies using