
Page 22 - Read Online
P. 22
Puyana et al. J Transl Genet Genom 2022;6:223-239 https://dx.doi.org/10.20517/jtgg.2021.51 Page 229
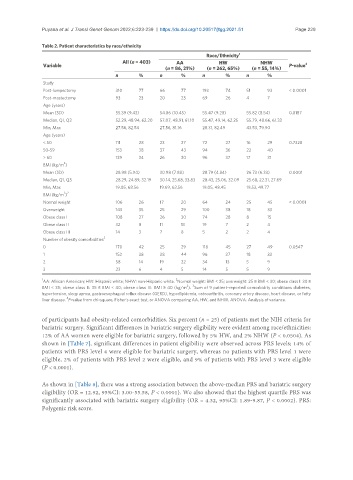
Table 2. Patient characteristics by race/ethnicity
Race/Ethnicity 1
All (n = 403) AA HW NHW
Variable P-value 4
(n = 86, 21%) (n = 262, 65%) (n = 55, 14%)
n % n % n % n %
Study
Post-lumpectomy 310 77 66 77 193 74 51 93 < 0.0001
Post-mastectomy 93 23 20 23 69 26 4 7
Age (years)
Mean (SD) 55.39 (9.43) 54.86 (10.45) 55.47 (9.28) 55.82 (8.54) 0.8187
Median, Q1, Q3 52.29, 48.94, 62.20 57.07, 48.91, 61.10 55.47, 49.14, 62.25 55.79, 48.66, 61.33
Min, Max 27.56, 82.54 27.56, 81.16 28.31, 82.49 43.53, 79.90
Age (years)
< 50 111 28 23 27 72 27 16 29 0.7328
50-59 153 38 37 43 94 36 22 40
> 60 139 34 26 30 96 37 17 31
2
BMI (kg/m )
Mean (SD) 28.98 (5.94) 30.98 (7.88) 28.79 (4.84) 26.73 (6.33) 0.0001
Median, Q1, Q3 28.29, 24.89, 32.19 30.14, 25.68, 33.83 28.43, 25.06, 32.09 25.68, 22.31, 27.69
Min, Max 19.05, 68.56 19.69, 63.56 19.05, 48.45 19.53, 49.77
2 2
BMI (kg/m )
Normal weight 106 26 17 20 64 24 25 45 < 0.0001
Overweight 143 35 25 29 100 38 18 33
Obese class I 108 27 26 30 74 28 8 15
Obese class II 32 8 11 13 19 7 2 4
Obese class III 14 3 7 8 5 2 2 4
3
Number of obesity comorbidities
0 170 42 25 29 118 45 27 49 0.0547
1 152 38 38 44 96 37 18 33
2 58 14 19 22 34 13 5 9
3 23 6 4 5 14 5 5 9
1 2
AA: African American; HW: Hispanic white; NHW: non-Hispanic white. Normal weight: BMI < 25; overweight: 25 ≤ BMI < 30; obese class I: 30 ≤
2 3
BMI < 35; obese class II: 35 ≤ BMI < 40; obese class III: BMI ≥ 40 (kg/m ). Sum of 9 patient-reported comorbidity conditions diabetes,
hypertension, sleep apnea, gastroesophageal reflux disease (GERD), hyperlipidemia, osteoarthritis, coronary artery disease, heart disease, or fatty
4
liver disease. P-value from chi-square, Fisher’s exact test, or ANOVA comparing AA, HW, and NHW. ANOVA: Analysis of variance.
of participants had obesity-related comorbidities. Six percent (n = 25) of patients met the NIH criteria for
bariatric surgery. Significant differences in bariatric surgery eligibility were evident among race/ethnicities:
12% of AA women were eligible for bariatric surgery, followed by 5% HW, and 2% NHW (P < 0.0504). As
shown in [Table 7], significant differences in patient eligibility were observed across PRS levels; 14% of
patients with PRS level 4 were eligible for bariatric surgery, whereas no patients with PRS level 1 were
eligible, 2% of patients with PRS level 2 were eligible, and 9% of patients with PRS level 3 were eligible
(P < 0.0001).
As shown in [Table 8], there was a strong association between the above-median PRS and bariatric surgery
eligibility (OR = 12.92, 95%CI: 3.00-55.58, P < 0.0001). We also showed that the highest quartile PRS was
significantly associated with bariatric surgery eligibility (OR = 4.32, 95%CI: 1.89-9.87, P < 0.0002). PRS:
Polygenic risk score.