
Page 23 - Read Online
P. 23
Page 230 Puyana et al. J Transl Genet Genom 2022;6:223-239 https://dx.doi.org/10.20517/jtgg.2021.51
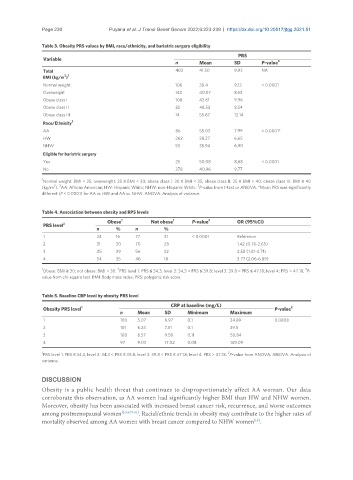
Table 3. Obesity PRS values by BMI, race/ethnicity, and bariatric surgery eligibility
PRS
Variable
n Mean SD P-value 3
Total 403 41.50 9.93 NA
2 1
BMI (kg/m )
Normal weight 106 38.4 9.13 < 0.0001
Overweight 143 40.07 8.53
Obese class I 108 42.61 9.96
Obese class II 32 48.53 8.54
Obese class III 14 55.67 12.14
Race/Ethnicity 2
AA 86 55.03 7.99 < 0.0001*
HW 262 38.27 6.65
NHW 55 35.94 6.90
Eligible for bariatric surgery
Yes 25 50.08 8.68 < 0.0001
No 378 40.96 9.77
1
Normal weight: BMI < 25; overweight: 25 ≤ BMI < 30; obese class I: 30 ≤ BMI < 35; obese class II: 35 ≤ BMI < 40; obese class III: BMI ≥ 40
2 2 3
(kg/m ). AA: African American; HW: Hispanic White; NHW: non-Hispanic White. P-value from t-test or ANOVA. *Mean PRS was significantly
different (P < 0.0001) for AA vs. HW and AA vs. NHW. ANOVA: Analysis of variance.
Table 4. Association between obesity and RPS levels
Obese 1 Not obese 1 P-value 3 OR (95%CI)
PRS level 2
n % n %
1 24 16 77 31 < 0.0001 Reference
2 31 20 70 28 1.42 (0.76-2.65)
3 45 29 56 22 2.58 (1.41-4.71)
4 54 35 46 18 3.77 (2.06-6.89)
1 2 3
Obese: BMI ≥ 30; not obese: BMI < 30. PRS level 1: PRS ≤ 34.3; level 2: 34.3 < PRS ≤ 39.8; level 3: 39.8 < PRS ≤ 47.18; level 4: PRS > 47.18. P-
value from chi-square test. BMI: Body mass index; PRS: polygenic risk score.
Table 5. Baseline CRP level by obesity PRS level
CRP at baseline (mg/L)
Obesity PRS level 1 P-value 2
n Mean SD Minimum Maximum
1 100 5.07 6.97 0.1 34.89 0.0808
2 101 6.23 7.51 0.1 39.5
3 100 6.57 9.58 0.11 50.84
4 97 9.03 17.02 0.08 149.09
1 2
PRS level 1: PRS ≤ 34.3; level 2: 34.3 < PRS ≤ 39.8; level 3: 39.8 < PRS ≤ 47.18; level 4: PRS > 47.18. P-value from ANOVA. ANOVA: Analysis of
variance.
DISCUSSION
Obesity is a public health threat that continues to disproportionately affect AA woman. Our data
corroborate this observation, as AA women had significantly higher BMI than HW and NHW women.
Moreover, obesity has been associated with increased breast cancer risk, recurrence, and worse outcomes
among postmenopausal women [2,3,8,77-81] . Racial/ethnic trends in obesity may contribute to the higher rates of
mortality observed among AA women with breast cancer compared to NHW women .
[18]