
Page 24 - Read Online
P. 24
Puyana et al. J Transl Genet Genom 2022;6:223-239 https://dx.doi.org/10.20517/jtgg.2021.51 Page 231
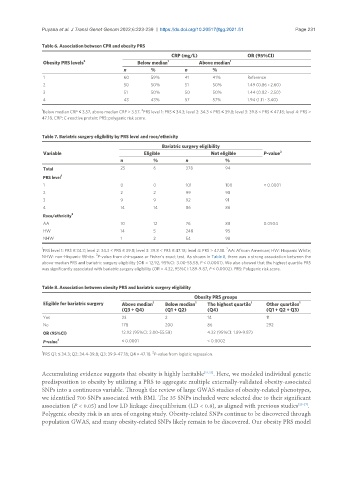
Table 6. Association between CPR and obesity PRS
CRP (mg/L) OR (95%CI)
Obesity PRS levels 2 Below median 1 Above median 1
n % n %
1 60 59% 41 41% Reference
2 50 50% 51 50% 1.49 (0.86 - 2.60)
3 51 50% 50 50% 1.44 (0.82 - 2.50)
4 43 43% 57 57% 1.94 (1.11 - 3.40)
1 2
Below median CRP ≤ 3.57, above median CRP > 3.57. PRS level 1: PRS ≤ 34.3; level 2: 34.3 < PRS ≤ 39.8; level 3: 39.8 < PRS ≤ 47.18; level 4: PRS >
47.18. CRP: C-reactive protein; PRS: polygenic risk score.
Table 7. Bariatric surgery eligibility by PRS level and race/ethnicity
Bariatric surgery eligibility
Variable Eligible Not eligible P-value 3
n % n %
Total 25 6 378 94
PRS level 1
1 0 0 101 100 < 0.0001
2 2 2 99 98
3 9 9 92 91
4 14 14 86 86
Race/ethnicity 2
AA 10 12 76 88 0.0504
HW 14 5 248 95
NHW 1 2 54 98
1 2
PRS level 1: PRS ≤ 34.3; level 2: 34.3 < PRS ≤ 39.8; level 3: 39.8 < PRS ≤ 47.18; level 4: PRS > 47.18. AA: African American; HW: Hispanic White;
3
NHW: non-Hispanic White. P-value from chi-square or Fisher’s exact test. As shown in Table 8, there was a strong association between the
above-median PRS and bariatric surgery eligibility (OR = 12.92, 95%CI: 3.00-55.58, P < 0.0001). We also showed that the highest quartile PRS
was significantly associated with bariatric surgery eligibility (OR = 4.32, 95%CI: 1.89-9.87, P < 0.0002). PRS: Polygenic risk score.
Table 8. Association between obesity PRS and bariatric surgery eligibility
Obesity PRS groups
Eligible for bariatric surgery Above median 1 Below median 1 The highest quartile 1 Other quartiles 1
(Q3 + Q4) (Q1 + Q2) (Q4) (Q1 + Q2 + Q3)
Yes 23 2 14 11
No 178 200 86 292
OR (95%CI) 12.92 (95%CI: 3.00-55.58) 4.32 (95%CI: 1.89-9.87)
P-value 2 < 0.0001 < 0.0002
1 2
PRS Q1: ≤ 34.3; Q2: 34.4-39.8; Q3: 39.9-47.18; Q4 > 47.18. P-value from logistic regression.
Accumulating evidence suggests that obesity is highly heritable [21,23] . Here, we modeled individual genetic
predisposition to obesity by utilizing a PRS to aggregate multiple externally-validated obesity-associated
SNPs into a continuous variable. Through the review of large GWAS studies of obesity-related phenotypes,
we identified 700 SNPs associated with BMI. The 35 SNPs included were selected due to their significant
association (P < 0.05) and low LD linkage disequilibrium (LD < 0.8), as aligned with previous studies [25-27] .
Polygenic obesity risk is an area of ongoing study. Obesity-related SNPs continue to be discovered through
population GWAS, and many obesity-related SNPs likely remain to be discovered. Our obesity PRS model