
Page 19 - Read Online
P. 19
Ding et al. J Transl Genet Genom 2021;5:50-61 I http://dx.doi.org/10.20517/jtgg.2020.01 Page 53
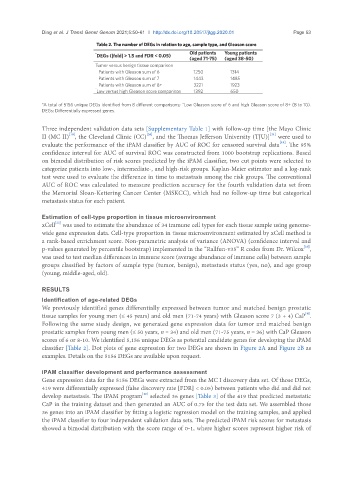
Table 2. The number of DEGs in relation to age, sample type, and Gleason score
* DEGs (|fold| > 1.5 and FDR < 0.05) Old patients Young patients
(aged 38-50)
(aged 71-75)
Tumor versus benign tissue comparison
Patients with Gleason sum of 6 1250 1314
Patients with Gleason sum of 7 1443 1485
Patients with Gleason sum of 8+ 3221 1923
^
Low versus high Gleason score comparison 1392 650
*A total of 5156 unique DEGs identified from 8 different comparisons; ^Low Gleason score of 6 and high Gleason score of 8+ (8 to 10).
DEGs: Differentially expressed genes.
Three independent validation data sets [Supplementary Table 1] with follow-up time [the Mayo Clinic
[20]
[21]
II (MC II) , the Cleveland Clinic (CC) , and the Thomas Jefferson University (TJU)] were used to
[19]
[19]
evaluate the performance of the iPAM classifier by AUC of ROC for censored survival data . The 95%
confidence interval for AUC of survival ROC was constructed from 1000 bootstrap replications. Based
on bimodal distribution of risk scores predicted by the iPAM classifier, two cut points were selected to
categorize patients into low-, intermediate-, and high-risk groups. Kaplan-Meier estimator and a log-rank
test were used to evaluate the difference in time to metastasis among the risk groups. The conventional
AUC of ROC was calculated to measure prediction accuracy for the fourth validation data set from
the Memorial Sloan-Kettering Cancer Center (MSKCC), which had no follow-up time but categorical
metastasis status for each patient.
Estimation of cell-type proportion in tissue microenvironment
[22]
xCell was used to estimate the abundance of 34 immune cell types for each tissue sample using genome-
wide gene expression data. Cell-type proportion in tissue microenvironment estimated by xCell method is
a rank-based enrichment score. Non-parametric analysis of variance (ANOVA) (confidence interval and
p-values generated by percentile bootstrap) implemented in the “Rallfun-v35” R codes from Dr. Wilcox ,
[23]
was used to test median differences in immune score (average abundance of immune cells) between sample
groups classified by factors of sample type (tumor, benign), metastasis status (yes, no), and age group
(young, middle-aged, old).
RESULTS
Identification of age-related DEGs
We previously identified genes differentially expressed between tumor and matched benign prostatic
[9]
tissue samples for young men (≤ 45 years) and old men (71-74 years) with Gleason score 7 (3 + 4) CaP .
Following the same study design, we generated gene expression data for tumor and matched benign
prostatic samples from young men (≤ 50 years, n = 34) and old men (71-75 years, n = 36) with CaP Gleason
scores of 6 or 8-10. We identified 5,156 unique DEGs as potential candidate genes for developing the iPAM
classifier [Table 2]. Dot plots of gene expression for two DEGs are shown in Figure 2A and Figure 2B as
examples. Details on the 5156 DEGs are available upon request.
iPAM classifier development and performance assessment
Gene expression data for the 5156 DEGs were extracted from the MC I discovery data set. Of those DEGs,
419 were differentially expressed (false discovery rate [FDR] < 0.05) between patients who did and did not
[18]
develop metastasis. The iPAM program selected 36 genes [Table 3] of the 419 that predicted metastatic
CaP in the training dataset and then generated an AUC of 0.75 for the test data set. We assembled those
36 genes into an iPAM classifier by fitting a logistic regression model on the training samples, and applied
the iPAM classifier to four independent validation data sets. The predicted iPAM risk scores for metastasis
showed a bimodal distribution with the score range of 0-1, where higher scores represent higher risk of