
Page 23 - Read Online
P. 23
Ding et al. J Transl Genet Genom 2021;5:50-61 I http://dx.doi.org/10.20517/jtgg.2020.01 Page 57
Table 4. AUC of five-year survival ROC for validation data stratified by Gleason score and age at diagnosis
Gleason score Age 40-78 Age ≤ 55 Age 56-70 Age > 70
6-10 (n = 421, 135) * (n = 79, 23) (n = 298, 93) (n = 44, 19)
0.82 (0.77, 0.86) 0.87 (0.78, 0.94) 0.82 (0.76, 0.88) 0.69 (0.55, 0.82)
7-10 (n = 357, 134) (n = 60, 23) (n = 257, 92) (n = 40, 19)
0.80 (0.74, 0.85) 0.85 (0.75, 0.93) 0.81 (0.74, 0.86) 0.67 (0.50, 0.80)
7 (n = 252, 58) (n = 48, 12) (n = 184, 41) (n = 20, 5)
^
^
0.83 (0.74, 0.90) 0.87 (NA ) 0.83 (0.73, 0.91) 0.79 (NA )
*The number of patients without and with metastasis, respectively; ^insufficient sample of metastatic patients to calculate 95%
confidence interval by the bootstrap method.
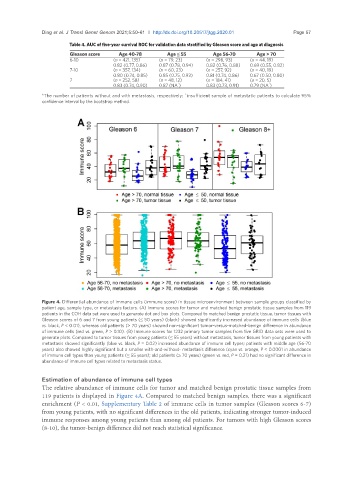
Figure 4. Differential abundance of immune cells (immune score) in tissue microenvironment between sample groups classified by
patient age, sample type, or metastasis factors. (A) Immune scores for tumor and matched benign prostatic tissue samples from 119
patients in the COH data set were used to generate dot and box plots. Compared to matched benign prostatic tissue, tumor tissues with
Gleason scores of 6 and 7 from young patients (≤ 50 years) (black) showed significantly increased abundance of immune cells (blue
vs. black, P < 0.01), whereas old patients (> 70 years) showed non-significant tumor-versus-matched-benign difference in abundance
of immune cells (red vs. green, P > 0.10). (B) Immune scores for 1232 primary tumor samples from five GRID data sets were used to
generate plots. Compared to tumor tissues from young patients (≤ 55 years) without metastasis, tumor tissues from young patients with
metastasis showed significantly (blue vs. black, P = 0.02) increased abundance of immune cell types; patients with middle age (56-70
years) also showed highly significant but a smaller with-and-without- metastasis difference (cyan vs. orange, P < 0.0001 in abundance
of immune cell types than young patients (≤ 55 years); old patients (≥ 70 years) (green vs. red, P = 0.21) had no significant difference in
abundance of immune cell types related to metastasis status.
Estimation of abundance of immune cell types
The relative abundance of immune cells for tumor and matched benign prostatic tissue samples from
119 patients is displayed in Figure 4A. Compared to matched benign samples, there was a significant
enrichment (P < 0.01, Supplementary Table 2 of immune cells in tumor samples (Gleason scores 6-7)
from young patients, with no significant differences in the old patients, indicating stronger tumor-induced
immune responses among young patients than among old patients. For tumors with high Gleason scores
(8-10), the tumor-benign difference did not reach statistical significance.