
Page 18 - Read Online
P. 18
Page 52 Ding et al. J Transl Genet Genom 2021;5:50-61 I http://dx.doi.org/10.20517/jtgg.2020.01
Table 1. Clinical and demographic characteristics of 119 City of Hope patients
Old Young
Total (71-75 years) (38-50 years)
Total patients 119 61 58
Metastatic patients 11 4 7
Mean follow-up (months) 65.3 65.8
Pathology stage
2a 12 (0.10) 5 (0.08) 7 (0.12)
2b 2 (0.02) 0 (0) 2 (0.03)
2c 77 (0.65) 41 (0.67) 36 (0.62)
3a 19 (0.16) 10 (0.16) 9 (0.16)
3b 9 (0.07) 5 (0.08) 4 (0.07)
Gleason score
6 37 (0.31) 18 (0.30) 19 (0.33)
7* 49 (0.41) 25 (0.41) 24 (0.41)
8 or 9 33 (0.28) 18 (0.29) 15 (0.26)
PrePSA^ (ng/mL)
≤ 10.0 100 (0.84) 53 (0.87) 47 (0.81)
> 10.0 19 (0.16) 8 (0.13) 11 (0.19)
Race
Caucasian 110 (0.92) 57 (0.93) 53 (0.91)
Asian 2 (0.02) 2 (0.03) 0
African American 6 (0.05) 2 (0.03) 4 (0.07)
Native American 1 (0.01) 0 1 (0.02)
*data for Gleason 7 patients were reported previously; ^PSA level before surgery; PSA: Prostate specific antigen.
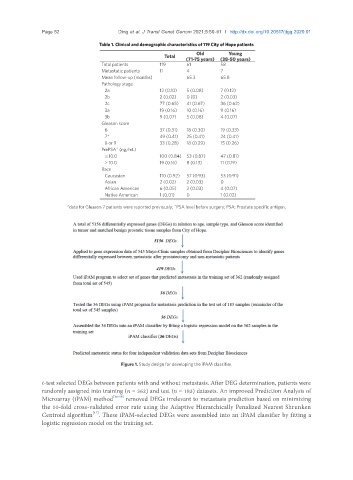
Figure 1. Study design for developing the iPAM classifier.
t-test selected DEGs between patients with and without metastasis. After DEG determination, patients were
randomly assigned into training (n = 362) and test (n = 183) datasets. An improved Prediction Analysis of
Microarray (iPAM) method [16-18] removed DEGs irrelevant to metastasis prediction based on minimizing
the 10-fold cross-validated error rate using the Adaptive Hierarchically Penalized Nearest Shrunken
[17]
Centroid algorithm . These iPAM-selected DEGs were assembled into an iPAM classifier by fitting a
logistic regression model on the training set.