
Page 42 - Read Online
P. 42
Page 411 Aydin et al. J Transl Genet Genom. 2025;9:406-26 https://dx.doi.org/10.20517/jtgg.2025.108
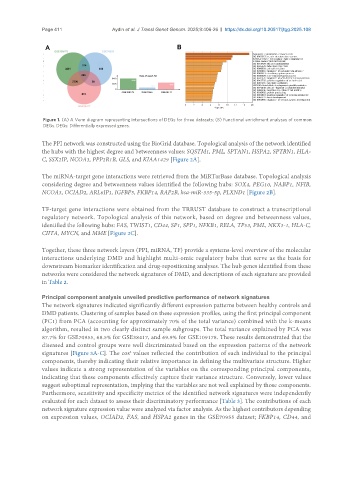
Figure 1. (A) A Venn diagram representing intersections of DEGs for three datasets; (B) Functional enrichment analyses of common
DEGs. DEGs: Differentially expressed genes.
The PPI network was constructed using the BioGrid database. Topological analysis of the network identified
the hubs with the highest degree and betweenness values: SQSTM1, PML, SPTAN1, HSPA2, SPTBN1, HLA-
C, SSX2IP, NCOA3, PPP2R1B, GLS, and KIAA1429 [Figure 2A].
The miRNA-target gene interactions were retrieved from the MiRTarBase database. Topological analysis
considering degree and betweenness values identified the following hubs: SOX4, PEG10, NABP1, NFIB,
NCOA3, OCIAD2, ARL6IP1, IGFBP5, FKBP14, RAP2B, hsa-miR-335-5p, PLXND1 [Figure 2B].
TF-target gene interactions were obtained from the TRRUST database to construct a transcriptional
regulatory network. Topological analysis of this network, based on degree and betweenness values,
identified the following hubs: FAS, TWIST1, CD44, SP1, SPP1, NFKB1, RELA, TP53, PML, NKX3-1, HLA-C,
CIITA, MYCN, and MME [Figure 2C].
Together, these three network layers (PPI, miRNA, TF) provide a systems-level overview of the molecular
interactions underlying DMD and highlight multi-omic regulatory hubs that serve as the basis for
downstream biomarker identification and drug-repositioning analyses. The hub genes identified from these
networks were considered the network signatures of DMD, and descriptions of each signature are provided
in Table 2.
Principal component analysis unveiled predictive performance of network signatures
The network signatures indicated significantly different expression patterns between healthy controls and
DMD patients. Clustering of samples based on these expression profiles, using the first principal component
(PC1) from PCA (accounting for approximately 70% of the total variance) combined with the k-means
algorithm, resulted in two clearly distinct sample subgroups. The total variance explained by PCA was
87.7% for GSE70955, 68.5% for GSE38417, and 69.9% for GSE109178. These results demonstrated that the
diseased and control groups were well discriminated based on the expression patterns of the network
2
signatures [Figure 3A-C]. The cos values reflected the contribution of each individual to the principal
components, thereby indicating their relative importance in defining the multivariate structure. Higher
values indicate a strong representation of the variables on the corresponding principal components,
indicating that these components effectively capture their variance structure. Conversely, lower values
suggest suboptimal representation, implying that the variables are not well explained by those components.
Furthermore, sensitivity and specificity metrics of the identified network signatures were independently
evaluated for each dataset to assess their discriminatory performance [Table 3]. The contributions of each
network signature expression value were analyzed via factor analysis. As the highest contributors depending
on expression values, OCIAD2, FAS, and HSPA2 genes in the GSE70955 dataset; FKBP14, CD44, and