
Page 40 - Read Online
P. 40
Page 409 Aydin et al. J Transl Genet Genom. 2025;9:406-26 https://dx.doi.org/10.20517/jtgg.2025.108
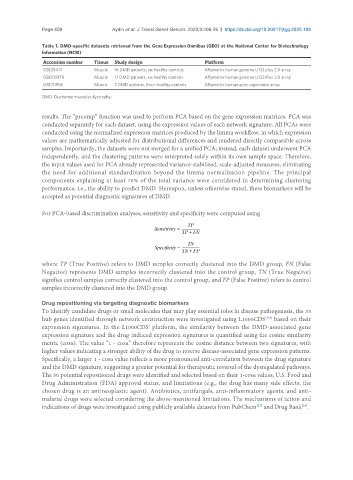
Table 1. DMD-specific datasets retrieved from the Gene Expression Omnibus (GEO) at the National Center for Biotechnology
Information (NCBI)
Accession number Tissue Study design Platform
GSE38417 Muscle 16 DMD patients, six healthy controls Affymetrix human genome U133 plus 2.0 array
GSE109178 Muscle 17 DMD patients, six healthy controls Affymetrix human genome U133 Plus 2.0 array
GSE70955 Muscle 3 DMD patients, three healthy controls Affymetrix human gene expression array
DMD: Duchenne muscular dystrophy.
results. The “prcomp” function was used to perform PCA based on the gene expression matrices. PCA was
conducted separately for each dataset, using the expression values of each network signature. All PCAs were
conducted using the normalized expression matrices produced by the limma workflow, in which expression
values are mathematically adjusted for distributional differences and rendered directly comparable across
samples. Importantly, the datasets were not merged for a unified PCA; instead, each dataset underwent PCA
independently, and the clustering patterns were interpreted solely within its own sample space. Therefore,
the input values used for PCA already represented variance-stabilized, scale-adjusted measures, eliminating
the need for additional standardization beyond the limma normalization pipeline. The principal
components explaining at least 70% of the total variance were considered in determining clustering
performance, i.e., the ability to predict DMD. Hereupon, unless otherwise stated, these biomarkers will be
accepted as potential diagnostic signatures of DMD.
For PCA-based discrimination analyses, sensitivity and specificity were computed using
where TP (True Positive) refers to DMD samples correctly clustered into the DMD group, FN (False
Negative) represents DMD samples incorrectly clustered into the control group, TN (True Negative)
signifies control samples correctly clustered into the control group, and FP (False Positive) refers to control
samples incorrectly clustered into the DMD group.
Drug repositioning via targeting diagnostic biomarkers
To identify candidate drugs or small molecules that may play essential roles in disease pathogenesis, the 33
hub genes identified through network construction were investigated using L1000CDS based on their
2[26]
2
expression signatures. In the L1000CDS platform, the similarity between the DMD-associated gene
expression signature and the drug-induced expression signatures is quantified using the cosine similarity
metric (cosα). The value “1 - cosα” therefore represents the cosine distance between two signatures, with
higher values indicating a stronger ability of the drug to reverse disease-associated gene expression patterns.
Specifically, a larger 1 - cosα value reflects a more pronounced anti-correlation between the drug signature
and the DMD signature, suggesting a greater potential for therapeutic reversal of the dysregulated pathways.
The 50 potential repositioned drugs were identified and selected based on their 1-cosα values, U.S. Food and
Drug Administration (FDA) approval status, and limitations (e.g., the drug has many side effects; the
chosen drug is an antineoplastic agent). Antibiotics, antifungals, anti-inflammatory agents, and anti-
malarial drugs were selected considering the above-mentioned limitations. The mechanisms of action and
indications of drugs were investigated using publicly available datasets from PubChem and Drug Bank .
[28]
[27]