
Page 79 - Read Online
P. 79
Nguyen et al. J Transl Genet Genom 2018;2:19 I http://dx.doi.org/10.20517/jtgg.2018.20 Page 5 of 11
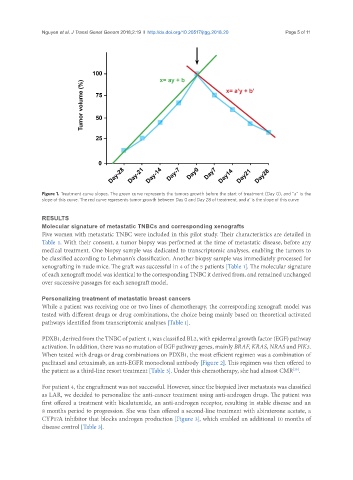
Figure 1. Treatment curve slopes. The green curve represents the tumors growth before the start of treatment (Day 0), and “a” is the
slope of this curve. The red curve represents tumor growth between Day 0 and Day 28 of treatment, and a’ is the slope of this curve
RESULTS
Molecular signature of metastatic TNBCs and corresponding xenografts
Five women with metastatic TNBC were included in this pilot study. Their characteristics are detailed in
Table 1. With their consent, a tumor biopsy was performed at the time of metastatic disease, before any
medical treatment. One biopsy sample was dedicated to transcriptomic analyses, enabling the tumors to
be classified according to Lehmann’s classification. Another biopsy sample was immediately processed for
xenografting in nude mice. The graft was successful in 4 of the 5 patients [Table 1]. The molecular signature
of each xenograft model was identical to the corresponding TNBC it derived from, and remained unchanged
over successive passages for each xenograft model.
Personalizing treatment of metastatic breast cancers
While a patient was receiving one or two lines of chemotherapy, the corresponding xenograft model was
tested with different drugs or drug combinations, the choice being mainly based on theoretical activated
pathways identified from transcriptomic analyses [Table 1].
PDXB1, derived from the TNBC of patient 1, was classified BL2, with epidermal growth factor (EGF) pathway
activation. In addition, there was no mutation of EGF pathway genes, mainly BRAF, KRAS, NRAS and PIK3.
When tested with drugs or drug combinations on PDXB1, the most efficient regimen was a combination of
paclitaxel and cetuximab, an anti-EGFR monoclonal antibody [Figure 2]. This regimen was then offered to
the patient as a third-line resort treatment [Table 3]. Under this chemotherapy, she had almost CMR .
[13]
For patient 4, the engraftment was not successful. However, since the biopsied liver metastasis was classified
as LAR, we decided to personalize the anti-cancer treatment using anti-androgen drugs. The patient was
first offered a treatment with bicalutamide, an anti-androgen receptor, resulting in stable disease and an
8 months period to progression. She was then offered a second-line treatment with abiraterone acetate, a
CYP17A inhibitor that blocks androgen production [Figure 3], which enabled an additional 10 months of
disease control [Table 3].