
Page 77 - Read Online
P. 77
Nguyen et al. J Transl Genet Genom 2018;2:19 I http://dx.doi.org/10.20517/jtgg.2018.20 Page 3 of 11
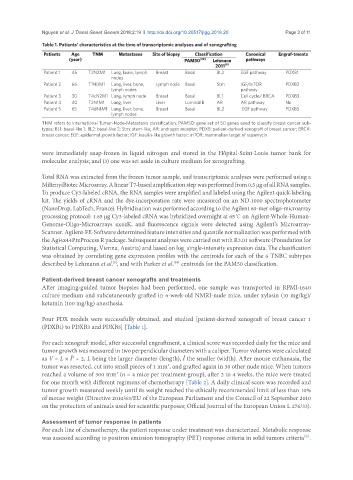
Table 1. Patients’ characteristics at the time of transcriptomic analyses and of xenografting
Patients Age TNM Metastases Site of biopsy Classification Canonical Engraf-tments
(year) PAM50 [20] Lehmann pathways
2011 [9]
Patient 1 45 T2N2M1 Lung, brain, lymph Breast Basal BL2 EGF pathway PDXB1
nodes
Patient 2 66 T1N0M1 Lung, liver, bone, Lymph node Basal Stm IGF/mTOR PDXB2
lymph nodes pathway
Patient 3 30 T4cN2M1 Lung, lymph node Breast Basal BL1 Cell cycle/ BRCA PDXB3
Patient 4 40 T2N1M1 Lung, liver Liver Luminal B AR AR pathway No
Patient 5 65 T4dN1M1 Lung, liver, bone, Breast Basal BL2 EGF pathway PDXB5
lymph nodes
TNM refers to international Tumor-Node-Metastasis classification; PAM50: gene set of 50 genes used to classify breast cancer sub-
types; BL1: basal-like 1; BL2: basal-like 2; Stm: stem-like; AR: androgen receptor; PDXB: patient-derived xenograft of breast cancer; BRCA:
breast cancer; EGF: epidermal growth factor; IGF: insulin-like growth factor; mTOR: mammalian target of rapamycin
were immediately snap-frozen in liquid nitrogen and stored in the Hôpital-Saint-Louis tumor bank for
molecular analysis; and (3) one was set aside in culture medium for xenografting.
Total RNA was extracted from the frozen tumor sample, and transcriptomic analyses were performed using a
MiltenyiBiotec Microarray. A linear T7-based amplification step was performed from 0.5 µg of all RNA samples.
To produce Cy3-labeled cRNA, the RNA samples were amplified and labeled using the Agilent-quick-labeling
kit. The yields of cRNA and the dye-incorporation rate were measured on an ND-1000 spectrophotometer
(NanoDrop, LabTech, France). Hybridization was performed according to the Agilent 60-mer oligo-microarray
processing protocol: 1.65 µg Cy3-labeled cRNA was hybridized overnight at 65 ℃ on Agilent-Whole-Human-
Genome-Oligo-Microarrays 4x44K, and fluorescence signals were detected using Agilent’s Microarray-
Scanner. Agilent-FE-Software determined feature intensities and quantile normalization was performed with
the Agi4x44PreProcess R package. Subsequent analyses were carried out with R3.01 software (Foundation for
Statistical Computing, Vienna, Austria) and based on log single-intensity expression data. The classification
2
was obtained by correlating gene expression profiles with the centroids for each of the 6 TNBC subtypes
described by Lehmann et al. , and with Parker et al. centroids for the PAM50 classification.
[20]
[9]
Patient-derived breast cancer xenografts and treatments
After imaging-guided tumor biopsies had been performed, one sample was transported in RPMI-1640
culture medium and subcutaneously grafted in 6-week-old NMRI-nude mice, under xylasin (10 mg/kg)/
ketamin (100 mg/kg) anesthesia.
Four PDX models were successfully obtained, and studied [patient-derived xenograft of breast cancer 1
(PDXB1) to PDXB3 and PDXB5] [Table 1].
For each xenograft model, after successful engraftment, a clinical score was recorded daily for the mice and
tumor growth was measured in two perpendicular diameters with a caliper. Tumor volumes were calculated
as V = L × Ɩ ÷ 2, L being the larger diameter (length), Ɩ the smaller (width). After mouse euthanasia, the
2
tumor was resected, cut into small pieces of 1 mm , and grafted again in 30 other nude mice. When tumors
3
reached a volume of 300 mm (n = 4 mice per treatment-group), after 2 to 4 weeks, the mice were treated
3
for one month with different regimens of chemotherapy [Table 2]. A daily clinical score was recorded and
tumor growth measured weekly until its weight reached the ethically recommended limit of less than 10%
of mouse weight (Directive 2010/63/EU of the European Parliament and the Council of 22 September 2010
on the protection of animals used for scientific purposes; Official Journal of the European Union L 276/33).
Assessment of tumor response in patients
For each line of chemotherapy, the patient response under treatment was characterized. Metabolic response
was assessed according to positron emission tomography (PET) response criteria in solid tumors criteria .
[21]