
Page 78 - Read Online
P. 78
Page 4 of 11 Nguyen et al. J Transl Genet Genom 2018;2:19 I http://dx.doi.org/10.20517/jtgg.2018.20
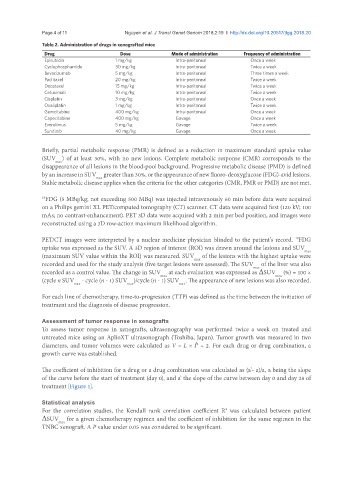
Table 2. Administration of drugs in xenografted mice
Drug Dose Mode of administration Frequency of administration
Epirubicin 1 mg/kg Intra-peritoneal Once a week
Cyclophosphamide 30 mg/kg Intra-peritoneal Twice a week
Bevacizumab 5 mg/kg Intra-peritoneal Three times a week
Paclitaxel 20 mg/kg Intra-peritoneal Twice a week
Docetaxel 15 mg/kg Intra-peritoneal Twice a week
Cetuximab 10 mg/kg Intra-peritoneal Twice a week
Cisplatin 3 mg/kg Intra-peritoneal Once a week
Oxaliplatin 1 mg/kg Intra-peritoneal Twice a week
Gemcitabine 400 mg/kg Intra-peritoneal Once a week
Capecitabine 400 mg/kg Gavage Once a week
Everolimus 5 mg/kg Gavage Twice a week
Sunitinib 40 mg/kg Gavage Once a week
Briefly, partial metabolic response (PMR) is defined as a reduction in maximum standard uptake value
(SUV ) of at least 30%, with no new lesions. Complete metabolic response (CMR) corresponds to the
max
disappearance of all lesions in the blood-pool background. Progressive metabolic disease (PMD) is defined
by an increase in SUV greater than 30%, or the appearance of new fluoro-deoxyglucose (FDG)-avid lesions.
max
Stable metabolic disease applies when the criteria for the other categories (CMR, PMR or PMD) are not met.
18 FDG (5 MBq/kg; not exceeding 500 MBq) was injected intravenously 60 min before data were acquired
on a Philips gemini XL PET/computed tomography (CT) scanner. CT data were acquired first (120 kV; 100
mAs; no contrast-enhancement). PET 3D data were acquired with 2 min per bed position, and images were
reconstructed using a 3D row-action maximum likelihood algorithm.
18
PET/CT images were interpreted by a nuclear medicine physician blinded to the patient’s record. FDG
uptake was expressed as the SUV. A 3D region of interest (ROI) was drawn around the lesions and SUV
max
(maximum SUV value within the ROI) was measured. SUV of the lesions with the highest uptake were
max
recorded and used for the study analysis (five target lesions were assessed). The SUV of the liver was also
max
recorded as a control value. The change in SUV at each evaluation was expressed as ΔSUV (%) = 100 ×
max
max
(cycle n SUV - cycle (n - 1) SUV )/cycle (n - 1) SUV . The appearance of new lesions was also recorded.
max max max
For each line of chemotherapy, time-to-progression (TTP) was defined as the time between the initiation of
treatment and the diagnosis of disease progression.
Assessment of tumor response in xenografts
To assess tumor response in xenografts, ultrasonography was performed twice a week on treated and
untreated mice using an AplioXT ultrasonograph (Toshiba, Japan). Tumor growth was measured in two
diameters, and tumor volumes were calculated as V = L × Ɩ ÷ 2. For each drug or drug combination, a
2
growth curve was established.
The coefficient of inhibition for a drug or a drug combination was calculated as (a’- a)/a, a being the slope
of the curve before the start of treatment (day 0), and a’ the slope of the curve between day 0 and day 28 of
treatment [Figure 1].
Statistical analysis
For the correlation studies, the Kendall rank correlation coefficient R was calculated between patient
2
ΔSUV for a given chemotherapy regimen and the coefficient of inhibition for the same regimen in the
max
TNBC xenograft. A P value under 0.05 was considered to be significant.