


Page 60 - Read Online
P. 60
Page 10 of 17                        Hu et al. J. Mater. Inf. 2025, 5, 44  https://dx.doi.org/10.20517/jmi.2025.21

               Table 1. Details of the NEU-DET dataset
                Split       Images                  Annotations                  Categories
                Train       1,080 items             2,488 items                  6 items
                Test        360 items               855 items                    6 items
                Val         360 items               846 items                    6 items


               Table 2. Performance metrics of the NEU-DET dataset: mAP and mAP_50
                                              NEU                     SSDD                   SSDD + NEU
                Performance metrics
                                        100e    400e    100e     200e    300e    400e     100e    200e
                mAP                     0.3160  0.3700  0.3790   0.3850  0.3790  0.3780   0.3810  0.3810
                mAP_50                  0.6910  0.7550  0.7630   0.7680  0.7420  0.7550   0.7540  0.7520
               The defect detection results corresponding to the SSDD-200e weight are the best, with the optimal values emphasized in bold. mAP: Mean
               average precision.


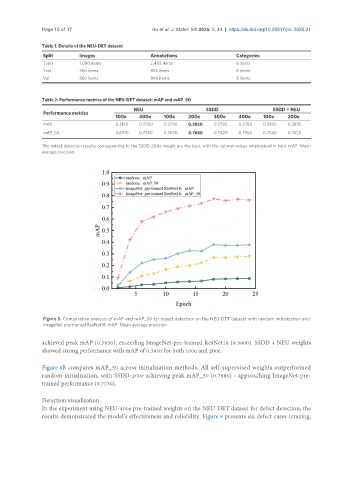
                Figure 5. Comparative analysis of mAP and mAP_50 for object detection on the NEU-DET dataset with random initialization and
                ImageNet pre-trained ResNet18. mAP: Mean average precision.

               achieved peak mAP (0.3850), exceeding ImageNet-pre-trained ResNet18 (0.3800). SSDD + NEU weights
               showed strong performance with mAP of 0.3810 for both 100e and 200e.

               Figure 8B compares mAP_50 across initialization methods. All self-supervised weights outperformed
               random initialization, with SSDD-200e achieving peak mAP_50 (0.7680) - approaching ImageNet-pre-
               trained performance (0.7730).

               Detection visualization
               In the experiment using NEU-400e pre-trained weights on the NEU-DET dataset for defect detection, the
               results demonstrated the model’s effectiveness and reliability. Figure 9 presents six defect cases (crazing,

