


Page 62 - Read Online
P. 62
Page 12 of 17                        Hu et al. J. Mater. Inf. 2025, 5, 44  https://dx.doi.org/10.20517/jmi.2025.21


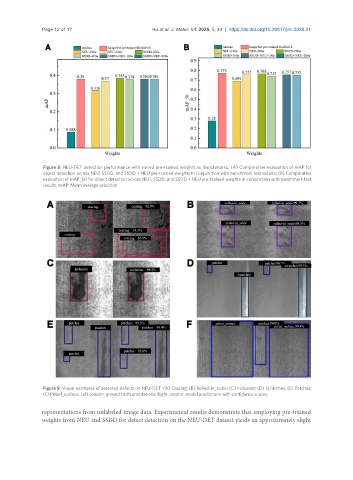
                Figure 8. NEU-DET detection performance with varied pre-trained weights vs. benchmarks. (A) Comparative evaluation of mAP for
                object detection across NEU, SSDD, and SSDD + NEU pre-trained weights in conjunction with benchmark test results; (B) Comparative
                evaluation of mAP_50 for object detection across NEU, SSDD, and SSDD + NEU pre-trained weights in conjunction with benchmark test
                results. mAP: Mean average precision.


                Figure 9. Visual examples of detected defects on NEU-DET. (A) Crazing; (B) Rolled-in_scale; (C) Inclusion; (D) Scratches; (E) Patches;
                (F) Pitted_surface. Left column: ground truth annotations; Right column: model predictions with confidence scores.


               representations from unlabeled image data. Experimental results demonstrate that employing pre-trained
               weights from NEU and SSDD for defect detection on the NEU-DET dataset yields an approximately slight

