


Page 61 - Read Online
P. 61
Hu et al. J. Mater. Inf. 2025, 5, 44  https://dx.doi.org/10.20517/jmi.2025.21   Page 11 of 17


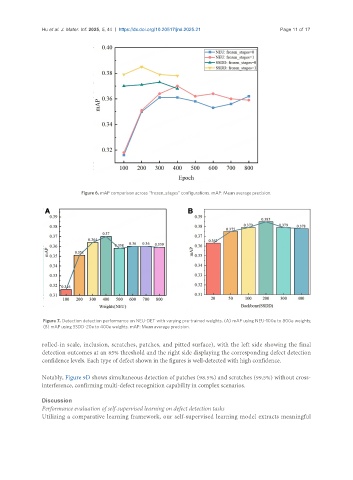
                            Figure 6. mAP comparison across “frozen_stages” configurations. mAP: Mean average precision.


                Figure 7. Detection detection performance on NEU-DET with varying pre-trained weights. (A) mAP using NEU-100e to 800e weights;
                (B) mAP using SSDD-20e to 400e weights. mAP: Mean average precision.


               rolled-in scale, inclusion, scratches, patches, and pitted surface), with the left side showing the final
               detection outcomes at an 85% threshold and the right side displaying the corresponding defect detection
               confidence levels. Each type of defect shown in the figures is well-detected with high confidence.


               Notably, Figure 9D shows simultaneous detection of patches (98.5%) and scratches (99.5%) without cross-
               interference, confirming multi-defect recognition capability in complex scenarios.


               Discussion
               Performance evaluation of self-supervised learning on defect detection tasks
               Utilizing a comparative learning framework, our self-supervised learning model extracts meaningful

