


Page 58 - Read Online
P. 58
Page 8 of 17                         Hu et al. J. Mater. Inf. 2025, 5, 44  https://dx.doi.org/10.20517/jmi.2025.21


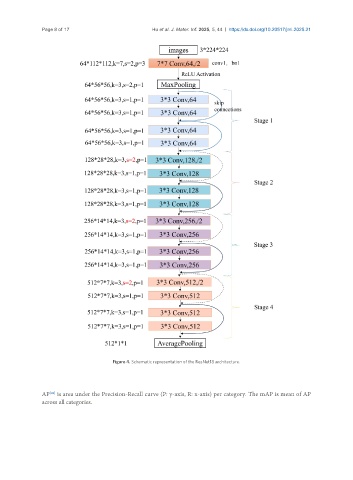
                                       Figure 4. Schematic representation of the ResNet18 architecture.


                  [44]
               AP  is area under the Precision-Recall curve (P: y-axis, R: x-axis) per category. The mAP is mean of AP
               across all categories.

