


Page 69 - Read Online
P. 69
Page 10 of 19                       Tang et al. J. Mater. Inf. 2025, 5, 38  https://dx.doi.org/10.20517/jmi.2025.05

               Table 2. ML prediction results of substitution energies (eV/cell) for Nb and α-Nb Si  alloys using SVR and RF methods
                                                                      5
                                                                        3
                                                                RMSE (SVR)                   RMSE (RF)
                Data sets (No. of data points)
                                                  Training   Test   Hyperparameter l     training  test
                Nb (210)                          0.077      0.092  0.1                  0.170     0.248
                Nb -Nb Si  (588)                  0.195      0.264  0.1                  0.316     0.476
                 I  5  3
                Nb -Nb Si  (1,764)                0.189      0.271  0.5                  0.361     0.514
                      3
                 II
                    5
                Si -Nb Si  (784)                  0.227      0.269  0.1                  0.252     0.347
                 I  5  3
                Si -Nb Si  (392)                  0.047      0.115  0.1                  0.254     0.359
                     3
                    5
                 II
                Combined Nb Si  (3,528)           0.416      0.495  0.5                  0.675     0.780
                        5  3
               ML: Machine learning; SVR: support vector regression; RF: random forest; RMSE: root mean square error.


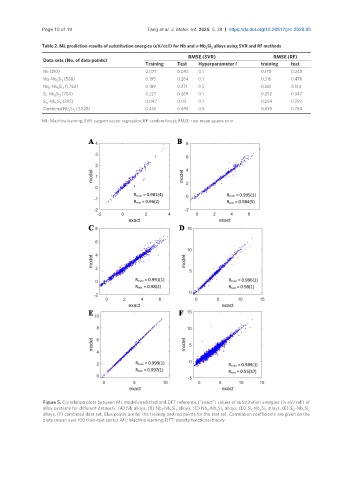
                Figure 5. Correlation plots between ML model-predicted and DFT reference (“exact”) values of substitution energies (in eV/cell) of
                alloy systems for different datasets. (A) Nb alloys, (B) Nb -Nb Si  alloys, (C) Nb -Nb Si  alloys, (D) Si -Nb Si  alloys, (E) Si -Nb Si   3
                                                                                      I
                                                                            3
                                                                                                    II
                                                                                                       5
                                                                                         5
                                                                                          3
                                                                          5
                                                          5
                                                        I
                                                            3
                                                                       II
                alloys, (F) combined data set. Blue points are for the training and red points for the test set. Correlation coefficients are given on the
                plots (mean over 100 train-test splits). ML: Machine learning; DFT: density functional theory.

