


Page 65 - Read Online
P. 65
Page 6 of 19                        Tang et al. J. Mater. Inf. 2025, 5, 38  https://dx.doi.org/10.20517/jmi.2025.05


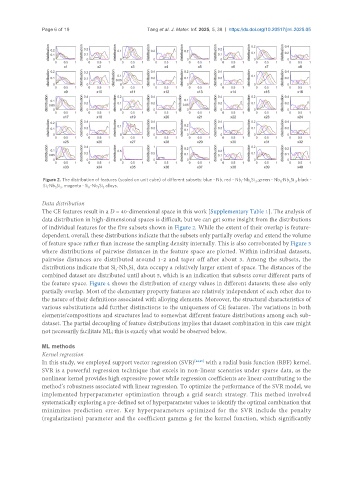
                Figure 2. The distribution of features (scaled on unit cube) of different subsets: blue - Nb, red - Nb -Nb Si , green - Nb -Nb Si , black -
                                                                                       3
                                                                                     5
                                                                                                    3
                                                                                                  5
                                                                                               II
                                                                                  I
                Si -Nb Si , magenta - Si -Nb Si  alloys.
                                  5
                                    3
                               II
                 I
                    5
                     3
               Data distribution
               The CE features result in a D = 40-dimensional space in this work [Supplementary Table 1]. The analysis of
               data distribution in high-dimensional spaces is difficult, but we can get some insight from the distributions
               of individual features for the five subsets shown in Figure 2. While the extent of their overlap is feature-
               dependent, overall, these distributions indicate that the subsets only partially overlap and extend the volume
               of feature space rather than increase the sampling density internally. This is also corroborated by Figure 3
               where distributions of pairwise distances in the feature space are plotted. Within individual datasets,
               pairwise distances are distributed around 1-2 and taper off after about 3. Among the subsets, the
               distributions indicate that Si -Nb Si  data occupy a relatively larger extent of space. The distances of the
                                              3
                                            5
                                        I
               combined dataset are distributed until about 5, which is an indication that subsets cover different parts of
               the feature space. Figure 4 shows the distribution of energy values in different datasets; these also only
               partially overlap. Most of the elementary property features are relatively independent of each other due to
               the nature of their definitions associated with alloying elements. Moreover, the structural characteristics of
               various substitutions add further distinctions to the uniqueness of CE features. The variations in both
               elements/compositions and structures lead to somewhat different feature distributions among each sub-
               dataset. The partial decoupling of feature distributions implies that dataset combination in this case might
               not necessarily facilitate ML; this is exactly what would be observed below.
               ML methods
               Kernel regression
               In this study, we employed support vector regression (SVR) [44,45]  with a radial basis function (RBF) kernel.
               SVR is a powerful regression technique that excels in non-linear scenarios under sparse data, as the
               nonlinear kernel provides high expressive power while regression coefficients are linear contributing to the
               method’s robustness associated with linear regression. To optimize the performance of the SVR model, we
               implemented hyperparameter optimization through a grid search strategy. This method involved
               systematically exploring a pre-defined set of hyperparameter values to identify the optimal combination that
               minimizes  prediction  error.  Key  hyperparameters  optimized  for  the  SVR  include  the  penalty
               (regularization) parameter and the coefficient gamma g for the kernel function, which significantly

