


Page 71 - Read Online
P. 71
Page 12 of 19                       Tang et al. J. Mater. Inf. 2025, 5, 38  https://dx.doi.org/10.20517/jmi.2025.05

               Table 3. RMSE in substitution energies (in eV/cell) of alloying elements predicted by GPR-NN and optimal hyperparameters (kernel
               length parameter l and noise parameter logσ) for different datasets

                                                         RMSE (GPR-NN)                Hyperparameters
                Data set
                                                Training        Test            l           logσ
                Nb (210)                        0.17 ± 0.01     0.21 ± 0.05     20          -6
                Nb -Nb Si  (588)                0.18 ± 0.01     0.25 ± 0.03     3           -5
                 I  5  3
                Nb -Nb Si  (1,764)              0.23 ± 0.01     0.29 ± 0.02     0.5         -5
                 II  5  3
                Si -Nb Si  (784)                0.27 ± 0.01     0.32 ± 0.04     0.5         -3
                 I
                     3
                   5
                Si -Nb Si  (392)                0.11 ± 0.003    0.14 ± 0.02     1.5         -4
                 II  5  3
                Combined Nb Si  (3,528)         0.43 ± 0.01     0.52 ± 0.03     0.1         -2.5
                        5  3
               The spread of values indicated by “±” is for 1 standard deviation over 100 runs differing by random train-test splits. RMSE: Root mean square error;
               GPR-NN: Gaussian process regression-neural network.
               Table 4. RMSE of substitution energies (in eV/cell) of alloying elements when using different numbers of terms N in the coupled
               model of Equation (6)
                                         N = 100                  N = 200                  N = 500
                Data set
                                Training     Test        Training     Test        Training     Test
                Nb              0.17 ± 0.01  0.21 ± 0.05  0.16 ± 0.02  0.22 ± 0.05  0.16 ± 0.01  0.22 ± 0.06
                Nb -Nb Si       0.13 ± 0.01  0.26 ± 0.05  0.12 ± 0.01  0.25 ± 0.05  0.12 ± 0.01  0.25 ± 0.05
                 I  5  3
                Nb -Nb Si 3     0.11 ± 0.01  0.30 ± 0.07  0.11 ± 0.01  0.35 ± 0.11  0.11 ± 0.01  0.35 ± 0.13
                    5
                 II
                Si -Nb Si       0.24 ± 0.01  0.31 ± 0.04  0.24 ± 0.01  0.31 ± 0.04  0.24 ± 0.01  0.31 ± 0.04
                 I  5  3
                Si -Nb Si       0.09 ± 0.003  0.13 ± 0.01  0.09 ± 0.003  0.13 ± 0.02  0.09 ± 0.003  0.13 ± 0.01
                 II  5  3
                Combined Nb Si 3  0.36 ± 0.004  0.52 ± 0.05  0.37 ± 0.003  0.53 ± 0.04  0.38 ± 0.003  0.54 ± 0.03
                        5
               The spread of values indicated by “±” is for 1 standard deviation over 100 runs differing by random train-test splits. RMSE: Root mean square error.


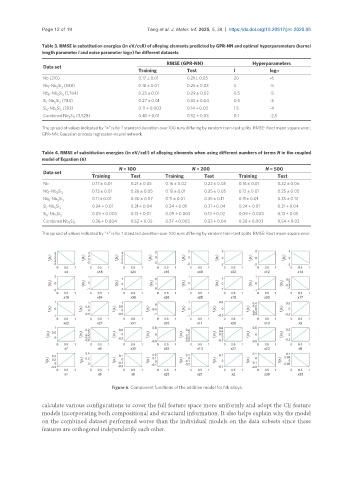
                                       Figure 6. Component functions of the additive model for Nb alloys.

               calculate various configurations to cover the full feature space more uniformly and adopt the CE feature
               models incorporating both compositional and structural information. It also helps explain why the model
               on the combined dataset performed worse than the individual models on the data subsets since these
               features are orthogonal independently each other.

