


Page 107 - Read Online
P. 107
Niu et al. J. Mater. Inf. 2025, 5, 45  https://dx.doi.org/10.20517/jmi.2025.22   Page 9 of 15


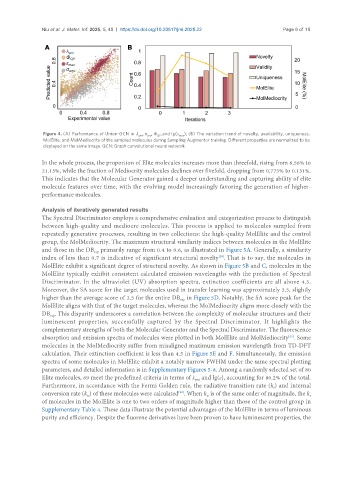
                Figure 4. (A) Performance of Union-GCN in  λ , σ , Φ , and lg(ε max ); (B) The variation trend of novelty, availability, uniqueness,
                                                emi
                                                      QY
                                                   emi
                MolElite, and MolMediocrity of the sampled molecules during Sampling Augmentor training. Different properties are normalized to be
                displayed on the same image. GCN: Graph convolutional neural network.
               In the whole process, the proportion of Elite molecules increases more than threefold, rising from 6.56% to
               21.13%, while the fraction of Mediocrity molecules declines over fivefold, dropping from 0.775% to 0.131%.
               This indicates that the Molecular Generator gained a deeper understanding and capturing ability of elite
               molecule features over time, with the evolving model increasingly favoring the generation of higher-
               performance molecules.


               Analysis of iteratively generated results
               The Spectral Discriminator employs a comprehensive evaluation and categorization process to distinguish
               between high-quality and mediocre molecules. This process is applied to molecules sampled from
               repeatedly generative processes, resulting in two collections: the high-quality MolElite and the control
               group, the MolMediocrity. The maximum structural similarity indices between molecules in the MolElite
               and those in the DB  primarily range from 0.4 to 0.6, as illustrated in Figure 5A. Generally, a similarity
                                 exp
               index of less than 0.7 is indicative of significant structural novelty . That is to say, the molecules in
                                                                           [28]
               MolElite exhibit a significant degree of structural novelty. As shown in Figure 5B and C, molecules in the
               MolElite typically exhibit consistent calculated emission wavelengths with the prediction of Spectral
               Discriminator. In the ultraviolet (UV) absorption spectra, extinction coefficients are all above 4.5.
               Moreover, the SA score for the target molecules used in transfer learning was approximately 3.5, slightly
               higher than the average score of 2.5 for the entire DB  in Figure 5D. Notably, the SA score peak for the
                                                              exp
               MolElite aligns with that of the target molecules, whereas the MolMediocrity aligns more closely with the
               DB . This disparity underscores a correlation between the complexity of molecular structures and their
                  exp
               luminescent  properties,  successfully  captured  by  the  Spectral  Discriminator.  It  highlights  the
               complementary strengths of both the Molecular Generator and the Spectral Discriminator. The fluorescence
                                                                                                  [33]
               absorption and emission spectra of molecules were plotted in both MolElite and MolMediocrity . Some
               molecules in the MolMediocrity suffer from misaligned maximum emission wavelength from TD-DFT
               calculation. Their extinction coefficient is less than 4.5 in Figure 5E and F. Simultaneously, the emission
               spectra of some molecules in MolElite exhibit a notably narrow FWHM under the same spectral plotting
               parameters, and detailed information is in Supplementary Figures 5-8. Among a randomly selected set of 80
               Elite molecules, 69 meet the predefined criteria in terms of λ  and lg(ε), accounting for 80.2% of the total.
                                                                   emi
               Furthermore, in accordance with the Fermi Golden rule, the radiative transition rate (k ) and internal
                                                                                             r
                                                             [33]
               conversion rate (k ) of these molecules were calculated . When k  is of the same order of magnitude, the k
                              ic
                                                                                                         r
                                                                       ic
               of molecules in the MolElite is one to two orders of magnitude higher than those of the control group in
               Supplementary Table 4. These data illustrate the potential advantages of the MolElite in terms of luminous
               purity and efficiency. Despite the fluorene derivatives have been proven to have luminescent properties, the

