


Page 109 - Read Online
P. 109
Niu et al. J. Mater. Inf. 2025, 5, 45  https://dx.doi.org/10.20517/jmi.2025.22  Page 11 of 15


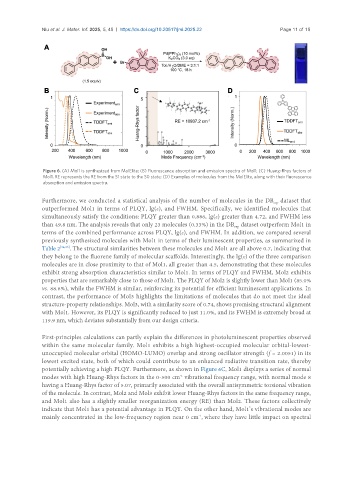
                Figure 6. (A) Mol1 is synthesized from MolElite; (B) Fluorescence absorption and emission spectra of Mol1; (C) Huang-Rhys factors of
                Mol1. RE represents the RE from the S1 state to the S0 state; (D) Examples of molecules from the MolElite, along with their fluorescence
                absorption and emission spectra.

               Furthermore, we conducted a statistical analysis of the number of molecules in the DB  dataset that
                                                                                             exp
               outperformed Mol1 in terms of PLQY, lg(ε), and FWHM. Specifically, we identified molecules that
               simultaneously satisfy the conditions: PLQY greater than 0.886, lg(ε) greater than 4.72, and FWHM less
               than 49.8 nm. The analysis reveals that only 23 molecules (0.33%) in the DB  dataset outperform Mol1 in
                                                                                exp
               terms of the combined performance across PLQY, lg(ε), and FWHM. In addition, we compared several
               previously synthesized molecules with Mol1 in terms of their luminescent properties, as summarized in
               Table 2 [34,35] . The structural similarities between these molecules and Mol1 are all above 0.7, indicating that
               they belong to the fluorene family of molecular scaffolds. Interestingly, the lg(ε) of the three comparison
               molecules are in close proximity to that of Mol1, all greater than 4.5, demonstrating that these molecules
               exhibit strong absorption characteristics similar to Mol1. In terms of PLQY and FWHM, Mol2 exhibits
               properties that are remarkably close to those of Mol1. The PLQY of Mol2 is slightly lower than Mol1 (85.0%
               vs. 88.6%), while the FWHM is similar, reinforcing its potential for efficient luminescent applications. In
               contrast, the performance of Mol3 highlights the limitations of molecules that do not meet the ideal
               structure-property relationships. Mol3, with a similarity score of 0.74, shows promising structural alignment
               with Mol1. However, its PLQY is significantly reduced to just 11.0%, and its FWHM is extremely broad at
               119.9 nm, which deviates substantially from our design criteria.

               First-principles calculations can partly explain the differences in photoluminescent properties observed
               within the same molecular family. Mol1 exhibits a high highest-occupied molecular orbital-lowest-
               unoccupied molecular orbital (HOMO-LUMO) overlap and strong oscillator strength (f = 2.0051) in its
               lowest excited state, both of which could contribute to an enhanced radiative transition rate, thereby
               potentially achieving a high PLQY. Furthermore, as shown in Figure 6C, Mol1 displays a series of normal
               modes with high Huang-Rhys factors in the 0-500 cm  vibrational frequency range, with normal mode 8
                                                              -1
               having a Huang-Rhys factor of 5.07, primarily associated with the overall antisymmetric torsional vibration
               of the molecule. In contrast, Mol2 and Mol3 exhibit lower Huang-Rhys factors in the same frequency range,
               and Mol1 also has a slightly smaller reorganization energy (RE) than Mol2. These factors collectively
               indicate that Mol1 has a potential advantage in PLQY. On the other hand, Mol1’s vibrational modes are
               mainly concentrated in the low-frequency region near 0 cm , where they have little impact on spectral
                                                                    -1

