


Page 90 - Read Online
P. 90
Page 14 of 31                       Shu et al. J. Mater. Inf. 2025, 5, 36  https://dx.doi.org/10.20517/jmi.2025.13


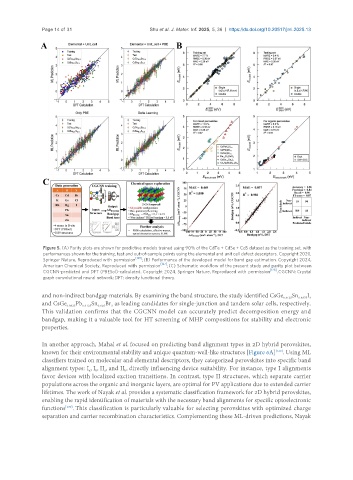
                Figure 5. (A) Parity plots are shown for predictive models trained using 90% of the CdTe + CdSe + CdS dataset as the training set, with
                performances shown for the training, test and out-of-sample points using the elemental and unit cell defect descriptors. Copyright 2020,
                Springer Nature, Reproduced with  permission [126] ; (B) Performance of the developed model for band gap estimation. Copyright 2024,
                American Chemical Society, Reproduced with  permission [127] ; (C) Schematic workflow of the present study and parity plot between
                CGCNN-predicted and DFT (PBESol)-calculated. Copyright 2024, Springer Nature, Reproduced with  permission [128] . CGCNN: Crystal
                graph convolutional neural network; DFT: density functional theory.

               and non-indirect bandgap materials. By examining the band structure, the study identified CsGe 0.3125 Sn 0.6875 3
                                                                                                         I
               and CsGe 0.0625 Pb 0.3125 Sn Br  as leading candidates for single-junction and tandem solar cells, respectively.
                                       3
                                  0.625
               This validation confirms that the CGCNN model can accurately predict decomposition energy and
               bandgap, making it a valuable tool for HT screening of MHP compositions for stability and electronic
               properties.


               In another approach, Mahal et al. focused on predicting band alignment types in 2D hybrid perovskites,
               known for their environmental stability and unique quantum-well-like structures [Figure 6A] . Using ML
                                                                                              [129]
               classifiers trained on molecular and elemental descriptors, they categorized perovskites into specific band
               alignment types: I , I , II , and II , directly influencing device suitability. For instance, type I alignments
                               a
                                 b
                                           b
                                    a
               favor devices with localized exciton transitions. In contrast, type II structures, which separate carrier
               populations across the organic and inorganic layers, are optimal for PV applications due to extended carrier
               lifetimes. The work of Nayak et al. provides a systematic classification framework for 2D hybrid perovskites,
               enabling the rapid identification of materials with the necessary band alignments for specific optoelectronic
               functions . This classification is particularly valuable for selecting perovskites with optimized charge
                       [130]
               separation and carrier recombination characteristics. Complementing these ML-driven predictions, Nayak

