


Page 114 - Read Online
P. 114
Shang et al. J. Mater. Inf. 2025, 5, 52  https://dx.doi.org/10.20517/jmi.2025.36  Page 7 of 15

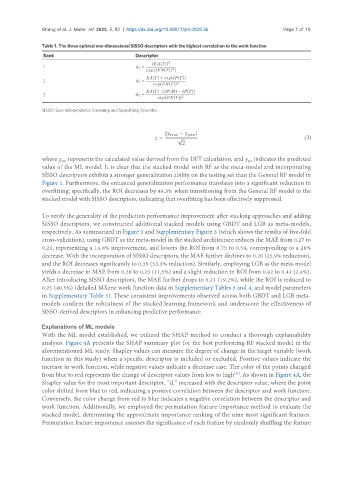
               Table 1. The three optimal one-dimensional SISSO descriptors with the highest correlation to the work function
                Rank                           Descriptor
                                                          3
                                                    (     (  ))
                1                                 1 =
                                                           2
                                                        ((    (  )) )
                                                       (  ) + exp(    (  ))
                2                                 2 =
                                                     exp(    (  ))  2
                                                       (  ) · (    (  ) −     (  ))
                3                                 3 =         2
                                                            (    (  ))
               SISSO: Sure Independence Screening and Sparsifying Operator.


                                                         |            −           |
                                                        =    √                                          (3)
                                                              2

               where y  represents the calculated value derived from the DFT calculation, and y  indicates the predicted
                      test
                                                                                     pre
               value of the ML model. It is clear that the stacked model with RF as the meta-model and incorporating
               SISSO descriptors exhibits a stronger generalization ability on the testing set than the General RF model in
               Figure 2. Furthermore, the enhanced generalization performance translates into a significant reduction in
               overfitting; specifically, the ROI decreases by 48.3% when transitioning from the General RF model to the
               stacked model with SISSO descriptors, indicating that overfitting has been effectively suppressed.


               To verify the generality of the prediction performance improvement after stacking approaches and adding
               SISSO descriptors, we constructed additional stacked models using GBDT and LGB as meta-models,
               respectively. As summarized in Figure 3 and Supplementary Figure 3 (which shows the results of five-fold
               cross-validation), using GBDT as the meta-model in the stacked architecture reduces the MAE from 0.27 to
               0.23, representing a 14.8% improvement, and lowers the ROI from 0.75 to 0.54, corresponding to a 28%
               decrease. With the incorporation of SISSO descriptors, the MAE further declines to 0.20 (25.9% reduction),
               and the ROI decreases significantly to 0.35 (53.3% reduction). Similarly, employing LGB as the meta-model
               yields a decrease in MAE from 0.26 to 0.23 (11.5%) and a slight reduction in ROI from 0.42 to 0.41 (2.4%).
               After introducing SISSO descriptors, the MAE further drops to 0.21 (19.2%), while the ROI is reduced to
               0.25 (40.5%) (detailed MXene work function data in Supplementary Tables 3 and 4, and model parameters
               in Supplementary Table 5). These consistent improvements observed across both GBDT and LGB meta-
               models confirm the robustness of the stacked learning framework and underscore the effectiveness of
               SISSO-derived descriptors in enhancing predictive performance.

               Explanations of ML models
               With the ML model established, we utilized the SHAP method to conduct a thorough explainability
               analysis. Figure 4A presents the SHAP summary plot for the best performing RF stacked model in the
               aforementioned ML study. Shapley values can measure the degree of change in the target variable (work
               function in this study) when a specific descriptor is included or excluded. Positive values indicate the
               increase in work function, while negative values indicate a decrease case. The color of the points changed
               from blue to red represents the change of descriptor values from low to high . As shown in Figure 4A, the
                                                                                [46]
               Shapley value for the most important descriptor, “d ” increased with the descriptor value, where the point
                                                           1
               color shifted from blue to red, indicating a positive correlation between the descriptor and work function.
               Conversely, the color change from red to blue indicates a negative correlation between the descriptor and
               work function. Additionally, we employed the permutation feature importance method to evaluate the
               stacked model, determining the approximate importance ranking of the nine most significant features.
               Permutation feature importance assesses the significance of each feature by randomly shuffling the feature

