


Page 113 - Read Online
P. 113
Page 6 of 15                       Shang et al. J. Mater. Inf. 2025, 5, 52  https://dx.doi.org/10.20517/jmi.2025.36


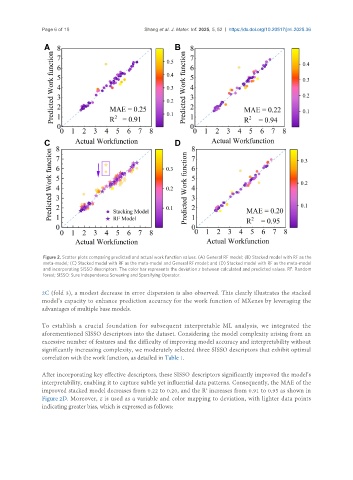
                Figure 2. Scatter plots comparing predicted and actual work function values. (A) General RF model; (B) Stacked model with RF as the
                meta-model; (C) Stacked model with RF as the meta-model and General RF model; and (D) Stacked model with RF as the meta-model
                and incorporating SISSO descriptors. The color bar represents the deviation z between calculated and predicted values. RF: Random
                forest; SISSO: Sure Independence Screening and Sparsifying Operator.

               2C (fold 3), a modest decrease in error dispersion is also observed. This clearly illustrates the stacked
               model’s capacity to enhance prediction accuracy for the work function of MXenes by leveraging the
               advantages of multiple base models.


               To  establish  a  crucial  foundation  for  subsequent  interpretable  ML  analysis,  we  integrated  the
               aforementioned SISSO descriptors into the dataset. Considering the model complexity arising from an
               excessive number of features and the difficulty of improving model accuracy and interpretability without
               significantly increasing complexity, we moderately selected three SISSO descriptors that exhibit optimal
               correlation with the work function, as detailed in Table 1.


               After incorporating key effective descriptors, these SISSO descriptors significantly improved the model’s
               interpretability, enabling it to capture subtle yet influential data patterns. Consequently, the MAE of the
                                                                      2
               improved stacked model decreases from 0.22 to 0.20, and the R  increases from 0.91 to 0.95 as shown in
               Figure 2D. Moreover, z is used as a variable and color mapping to deviation, with lighter data points
               indicating greater bias, which is expressed as follows:

