


Page 111 - Read Online
P. 111
Page 4 of 15                       Shang et al. J. Mater. Inf. 2025, 5, 52  https://dx.doi.org/10.20517/jmi.2025.36


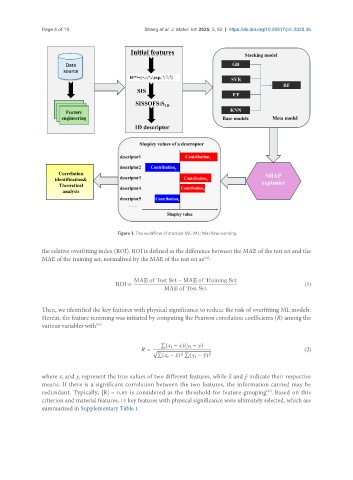
                                         Figure 1. The workflow of stacked ML. ML: Machine learning.

               the relative overfitting index (ROI). ROI is defined as the difference between the MAE of the test set and the
                                                                      [36]
               MAE of the training set, normalized by the MAE of the test set as :

                                              MAE of Test Set − MAE of Training Set
                                        ROI =                                                           (1)
                                                        MAE of Test Set


               Then, we identified the key features with physical significance to reduce the risk of overfitting ML models.
               Herein, the feature screening was initiated by computing the Pearson correlation coefficients (R) among the
               various variables with [36]


                                                       ∑
                                                         (      − ¯   )(      − ¯   )
                                                    = √ ∑      ∑                                        (2)
                                                              2        2
                                                        (      − ¯   )  (      − ¯   )
               where x and y represent the true values of two different features, while x and y  –
                                                                             –
                                                                                     indicate their respective
                      i
                            i
               means. If there is a significant correlation between the two features, the information carried may be
               redundant. Typically, |R| = 0.85 is considered as the threshold for feature grouping . Based on this
                                                                                           [37]
               criterion and material features, 15 key features with physical significance were ultimately selected, which are
               summarized in Supplementary Table 1.

