Page 23 - Read Online
P. 23

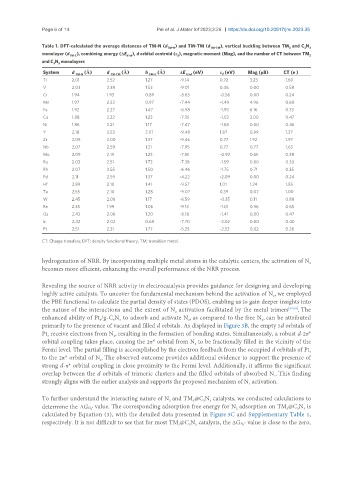
Page 6 of 14                           Pei et al. J Mater Inf 2023;3:26  https://dx.doi.org/10.20517/jmi.2023.35

               Table 1. DFT-calculated the average distances of TM-N (d TM-N ) and TM-TM (d TM-TM ), vertical buckling between TM  and C N 3
                                                                                                        3
                                                                                                  3
               monolayer (d TM-C ), combining energy (ΔE bind ), d orbital centroid (ε ), magnetic moment (Mag), and the number of CT between TM 3
                                                             d
               and C N  monolayers
                   3
                     3
                System   d  TM-N  (Å)  d TM-TM  (Å)  h TM-C  (Å)  ΔE bind  (eV)  ε d  (eV)  Mag (μB)  CT (e )
                Ti       2.01        2.52         1.27        -9.14        0.72      3.23        1.60
                V        2.03        2.38         1.53        -9.01        0.46      0.00        0.58
                Cr       1.94        1.93         0.89        -8.63        -0.56     0.00        0.24
                Mn       1.97        2.33         0.97        -7.44        -1.49     4.96        0.60
                Fe       1.92        2.27         1.47        -6.98        -1.93     6.16        0.33
                Co       1.88        2.22         1.23        -7.35        -1.53     3.00        0.47
                Ni       1.86        2.21         1.17        -7.47        -1.58     0.00        0.46
                Y        2.18        3.53         2.01        -9.48        1.87      0.99        1.27
                Zr       2.09        3.00         1.37        -9.46        0.77      1.92        1.97
                Nb       2.07        2.59         1.31        -7.95        0.77      0.77        1.63
                Mo       2.09        2.19         1.23        -7.51        -0.92     0.61        0.38
                Ru       2.03        2.51         1.73        -7.38        -1.59     0.00        0.30
                Rh       2.07        2.55         1.50        -6.46        -1.75     0.71        0.35
                Pd       2.11        2.59         1.37        -4.22        -2.09     0.00        0.24
                Hf       2.89        2.10         1.41        -9.57        1.01      1.24        1.85
                Ta       2.55        2.10         1.28        -9.07        0.39      0.07        1.00
                W        2.45        2.08         1.17        -6.59        -0.35     0.11        0.88
                Re       2.35        1.99         1.06        -9.13        -1.01     0.96        0.65
                Os       2.43        2.06         1.20        -8.18        -1.41     0.00        0.47
                Ir       2.42        2.02         0.68        -7.70        -2.02     0.00        0.40
                Pt       2.51        2.21         1.77        -5.25        -2.53     0.02        0.26
               CT: Charge transfers; DFT: density functional theory; TM: transition metal.


               hydrogenation of NRR. By incorporating multiple metal atoms in the catalytic centers, the activation of N 2
               becomes more efficient, enhancing the overall performance of the NRR process.

               Revealing the source of NRR activity in electrocatalysts provides guidance for designing and developing
               highly active catalysts. To uncover the fundamental mechanism behind the activation of N , we employed
                                                                                             2
               the PBE functional to calculate the partial density of states (PDOS), enabling us to gain deeper insights into
               the nature of the interactions and the extent of N  activation facilitated by the metal trimers [67,68] . The
                                                            2
               enhanced ability of Pt /g-C N  to adsorb and activate N , as compared to the free N , can be attributed
                                                                                         2
                                       3
                                                                2
                                         3
                                   3
               primarily to the presence of vacant and filled d orbitals. As displayed in Figure 3B, the empty 5d orbitals of
               Pt  receive electrons from N , resulting in the formation of bonding states. Simultaneously, a robust d-2π*
                                       2
                 3
               orbital coupling takes place, causing the 2π* orbital from N  to be fractionally filled in the vicinity of the
                                                                   2
               Fermi level. The partial filling is accomplished by the electron feedback from the occupied d orbitals of Pt 3
               to the 2π* orbital of N . The observed outcome provides additional evidence to support the presence of
                                   2
               strong d-π* orbital coupling in close proximity to the Fermi level. Additionally, it affirms the significant
               overlap between the d orbitals of trimeric clusters and the filled orbitals of absorbed N . This finding
                                                                                             2
               strongly aligns with the earlier analysis and supports the proposed mechanism of N  activation.
                                                                                     2
               To further understand the interacting nature of N  and TM @C N  catalysts, we conducted calculations to
                                                                      3
                                                                        3
                                                                  3
                                                          2
               determine the  ΔGN 2 * value. The corresponding adsorption free energy for N  adsorption on TM @C N  is
                                                                                                  3
                                                                                                     3
                                                                                                       3
                                                                                 2
               calculated by Equation (3), with the detailed data presented in Figure 3C and Supplementary Table 1,
               respectively. It is not difficult to see that for most TM @C N  catalysts, the ΔGN 2 * value is close to the zero,
                                                                 3
                                                                   3
                                                             3
   18   19   20   21   22   23   24   25   26   27   28