
Page 97 - Read Online
P. 97
Andjelkovic et al. J Environ Expo Assess 2024;3:23 https://dx.doi.org/10.20517/jeea.2024.22 Page 11 of 20
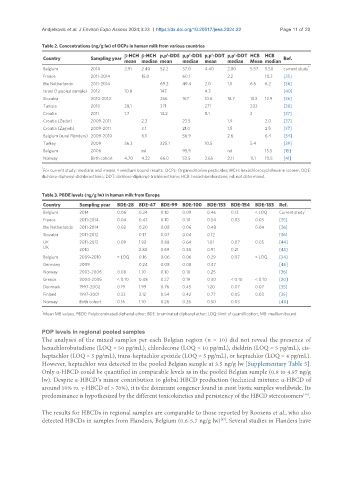
Table 2. Concentrations (ng/g lw) of OCPs in human milk from various countries
β-HCH β-HCH p,p’-DDE p,p’-DDE p,p’-DDT p,p’-DDT HCB HCB
Country Sampling year Ref.
mean median mean median mean median Mean median
*
Belgium 2014 2.91 2.40 52.2 37.0 4.40 2.80 5.57 5.50 current study
France 2011-2014 15.0 60.1 2.2 10.3 [35]
the Netherlands 2011-2014 69.2 49.4 2.0 1.5 6.5 6.2 [36]
Israel (1 pooled sample) 2012 10.8 147 4.3 [40]
Slovakia 2010-2012 266 167 10.6 18.7 13.3 12.9 [36]
Tunisia 2010 28.1 371 271 203 [38]
Croatia 2011 1.7 14.2 8.1 3 [37]
Croatia (Zadar) 2009-2011 2.3 23.5 1.9 2.0 [37]
Croatia (Zagreb) 2009-2011 3.1 21.0 1.5 2.5 [37]
Belgium (rural Flanders) 2009-2010 6.1 56.9 2.6 6.4 [34]
Turkey 2009 36.3 325.1 10.5 5.4 [39]
Belgium 2006 nd 95.9 nd 15.5 [15]
Norway Birth cohort 4.70 4.32 66.0 53.5 2.65 2.11 11.1 10.5 [41]
*
For current study: medians and means = medium bound results. OCPs: Organochlorine pesticides; HCH: hexachlorocyclohexane isomer; DDE:
dichloro-diphenyl-dichloroethane; DDT: dichloro-diphenyl-trichloroethane; HCB: hexachlorobenzene; nd: not determined.
Table 3. PBDE levels (ng/g lw) in human milk from Europe
Country Sampling year BDE-28 BDE-47 BDE-99 BDE-100 BDE-153 BDE-154 BDE-183 Ref.
Belgium 2014 0.06 0.24 0.10 0.09 0.46 0.13 < LOQ Current study *
France 2011-2014 0.04 0.43 0.10 0.10 0.54 0.03 0.05 [35]
the Netherlands 2011-2014 0.02 0.20 0.08 0.06 0.48 0.04 [36]
Slovakia 2011-2012 0.17 0.07 0.04 0.12 [36]
UK 2011-2012 0.09 1.92 0.88 0.64 1.01 0.07 0.05 [44]
UK
2010 2.80 0.69 0.38 0.91 0.21 [45]
Belgium 2009-2010 < LOQ 0.16 0.06 0.06 0.29 0.07 < LOQ [34]
Germany 2009 0.24 0.08 0.08 0.47 [46]
Norway 2003-2006 0.08 1.10 0.10 0.10 0.25 [36]
Greece 2004-2005 < 0.10 0.48 0.27 0.19 0.30 < 0.10 < 0.10 [20]
Denmark 1997-2002 0.19 1.99 0.76 0.45 1.20 0.07 0.07 [35]
Finland 1997-2001 0.33 3.12 0.54 0.42 0.77 0.05 0.03 [35]
Norway Birth cohort 0.16 1.10 0.26 0.26 0.50 0.03 [40]
*
Mean MB values. PBDE: Polybrominated diphenyl ether; BDE: brominated diphenyl ether; LOQ: limit of quantification; MB: medium bound.
POP levels in regional pooled samples
The analyses of the mixed samples per each Belgian region (n = 10) did not reveal the presence of
hexachlorobutadiene (LOQ = 50 pg/mL), chlordecone (LOQ = 10 pg/mL), dieldrin (LOQ = 5 pg/mL), cis-
heptachlor (LOQ = 5 pg/mL), trans-heptachlor epoxide (LOQ = 5 pg/mL), or heptachlor (LOQ = 4 pg/mL).
However, heptachlor was detected in the pooled Belgian sample at 3.5 ng/g lw [Supplementary Table 5].
Only α-HBCD could be quantified in comparable levels as in the pooled Belgian sample (0.9 to 4.97 ng/g
lw). Despite α-HBCD’s minor contribution to global HBCD production (technical mixture: α-HBCD of
around 10% vs. γ-HBCD of > 70%), it is the dominant congener found in most biotic samples worldwide. Its
[48]
predominance is hypothesized by the different toxicokinetics and persistency of the HBCD stereoisomers .
The results for HBCDs in regional samples are comparable to those reported by Roosens et al., who also
detected HBCDs in samples from Flanders, Belgium (0.6-5.7 ng/g lw) . Several studies in Flanders have
[47]