
Page 95 - Read Online
P. 95
Andjelkovic et al. J Environ Expo Assess 2024;3:23 https://dx.doi.org/10.20517/jeea.2024.22 Page 9 of 20
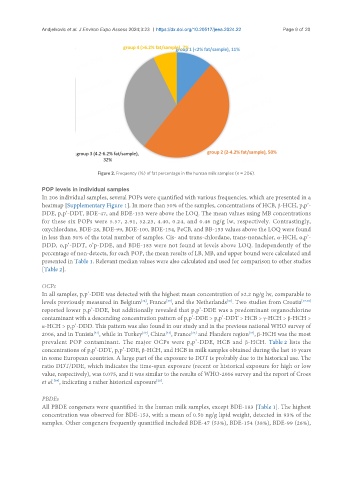
Figure 2. Frequency (%) of fat percentage in the human milk samples (n = 206).
POP levels in individual samples
In 206 individual samples, several POPs were quantified with various frequencies, which are presented in a
heatmap [Supplementary Figure 1]. In more than 50% of the samples, concentrations of HCB, β-HCH, p,p’-
DDE, p,p’-DDT, BDE-47, and BDE-153 were above the LOQ. The mean values using MB concentrations
for these six POPs were 5.57, 2.91, 52.23, 4.40, 0.24, and 0.46 ng/g lw, respectively. Contrastingly,
oxychlordane, BDE-28, BDE-99, BDE-100, BDE-154, PeCB, and BB-153 values above the LOQ were found
in less than 50% of the total number of samples. Cis- and trans-chlordane, trans-nonachlor, α-HCH, o,p’-
DDD, o,p’-DDT, o’p-DDE, and BDE-183 were not found at levels above LOQ. Independently of the
percentage of non-detects, for each POP, the mean results of LB, MB, and upper bound were calculated and
presented in Table 1. Relevant median values were also calculated and used for comparison to other studies
[Table 2].
OCPs
In all samples, p,p’-DDE was detected with the highest mean concentration of 52.2 ng/g lw, comparable to
[36]
[35]
[34]
levels previously measured in Belgium , France , and the Netherlands . Two studies from Croatia [37,38]
reported lower p,p’-DDE, but additionally revealed that p,p’-DDE was a predominant organochlorine
contaminant with a descending concentration pattern of p,p’-DDE > p,p’-DDT > HCB > γ-HCH > β-HCH >
α-HCH > p,p’-DDD. This pattern was also found in our study and in the previous national WHO survey of
[34]
2006, and in Tunisia , while in Turkey , China , France and Flanders region , β-HCH was the most
[42]
[35]
[43]
[39]
prevalent POP contaminant. The major OCPs were p,p’-DDE, HCB and β-HCH. Table 2 lists the
concentrations of p,p’-DDT, p,p’-DDE, β-HCH, and HCB in milk samples obtained during the last 10 years
in some European countries. A large part of the exposure to DDT is probably due to its historical use. The
ratio DDT/DDE, which indicates the time-span exposure (recent or historical exposure for high or low
value, respectively), was 0.075, and it was similar to the results of WHO-2006 survey and the report of Croes
et al. , indicating a rather historical exposure .
[34]
[20]
PBDEs
All PBDE congeners were quantified in the human milk samples, except BDE-183 [Table 1]. The highest
concentration was observed for BDE-153, with a mean of 0.50 ng/g lipid weight, detected in 93% of the
samples. Other congeners frequently quantified included BDE-47 (53%), BDE-154 (38%), BDE-99 (26%),