
Page 47 - Read Online
P. 47
Bogdan et al. J Environ Expo Assess 2024;3:14 https://dx.doi.org/10.20517/jeea.2024.08 Page 9 of 13
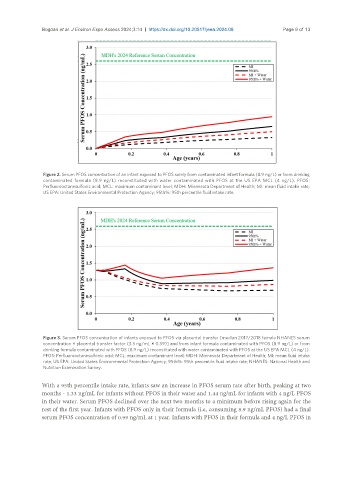
Figure 2. Serum PFOS concentration of an infant exposed to PFOS solely from contaminated infant formula (8.9 ng/L) or from drinking
contaminated formula (8.9 ng/L) reconstituted with water contaminated with PFOS at the US EPA MCL (4 ng/L). PFOS:
Perfluorooctanesulfonic acid; MCL: maximum contaminant level; MDH: Minnesota Department of Health; MI: mean fluid intake rate;
US EPA: United States Environmental Protection Agency; 95th%: 95th percentile fluid intake rate.
Figure 3. Serum PFOS concentration of infants exposed to PFOS via placental transfer [median 2017/2018 female NHANES serum
concentration × placental transfer factor (3.3 ng/mL × 0.39)] and from infant formula contaminated with PFOS (8.9 ng/L) or from
drinking formula contaminated with PFOS (8.9 ng/L) reconstituted with water contaminated with PFOS at the US EPA MCL (4 ng/L).
PFOS: Perfluorooctanesulfonic acid; MCL: maximum contaminant level; MDH: Minnesota Department of Health; MI: mean fluid intake
rate; US EPA: United States Environmental Protection Agency; 95th%: 95th percentile fluid intake rate; NHANES: National Health and
Nutrition Examination Survey.
With a 95th percentile intake rate, infants saw an increase in PFOS serum rate after birth, peaking at two
months - 1.33 ng/mL for infants without PFOS in their water and 1.44 ng/mL for infants with 4 ng/L PFOS
in their water. Serum PFOS declined over the next two months to a minimum before rising again for the
rest of the first year. Infants with PFOS only in their formula (i.e, consuming 8.9 ng/mL PFOS) had a final
serum PFOS concentration of 0.99 ng/mL at 1 year. Infants with PFOS in their formula and 4 ng/L PFOS in