
Page 44 - Read Online
P. 44
Page 6 of 13 Bogdan et al. J Environ Expo Assess 2024;3:14 https://dx.doi.org/10.20517/jeea.2024.08
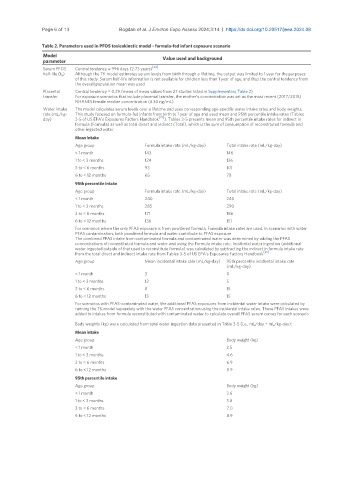
Table 2. Parameters used in PFOS toxicokinetic model - formula-fed infant exposure scenario
Model Value used and background
parameter
[24]
Serum PFOS Central tendency = 996 days (2.73 years)
half-life (t ) Although the TK model estimates serum levels from birth through a lifetime, the output was limited to 1 year for the purposes
½
of this study. Serum half-life information is not available for children less than 1 year of age, and thus the central tendency from
the overall population mean was used
Placental Central tendency = 0.39 (mean of mean values from 27 studies listed in Supplementary Table 2)
transfer For exposure scenarios that include placental transfer, the mother’s concentration was set as the most recent (2017/2018)
NHANES female median concentration (3.30 ng/mL)
Water intake The model calculates serum levels over a lifetime and uses corresponding age-specific water intake rates and body weights.
rate (mL/kg- This study focused on formula-fed infants from birth to 1 year of age and used mean and 95th percentile intake rates (Tables
[25]
day) 3-5 of US EPA’s Exposures Factors Handbook ). Tables 3-5 presents mean and 95th percentile intake rates for indirect in
formula (Formula) as well as total direct and indirect (Total), which is the sum of consumption of reconstituted formula and
other ingested water
Mean intake
Age group Formula intake rate (mL/kg-day) Total intake rate (mL/kg-day)
< 1 month 143 146
1 to < 3 months 124 136
3 to < 6 months 93 101
6 to < 12 months 65 78
95th percentile intake
Age group Formula intake rate (mL/kg-day) Total intake rate (mL/kg-day)
< 1 month 240 240
1 to < 3 months 285 290
3 to < 6 months 171 186
6 to < 12 months 136 151
For scenarios where the only PFAS exposure is from powdered formula, Formula intake rates are used. In scenarios with water
PFAS contamination, both powdered formula and water contribute to PFAS exposure
The combined PFAS intake from contaminated formula and contaminated water was determined by adding the PFAS
concentrations of reconstituted formula and water and using the Formula intake rate. Incidental water ingestion (additional
water ingested outside of that used to reconstitute formula) was calculated by subtracting the indirect in formula intake rate
from the total direct and indirect intake rate from Tables 3-5 of US EPA’s Exposures Factors Handbook [25]
Age group Mean incidental intake rate (mL/kg-day) 95th percentile incidental intake rate
(mL/kg-day)
< 1 month 3 0
1 to < 3 months 12 5
3 to < 6 months 8 15
6 to < 12 months 13 15
For scenarios with PFAS-contaminated water, the additional PFAS exposures from incidental water intake were calculated by
running the TK model separately with the water PFAS concentration using the incidental intake rates. Those PFAS intakes were
added to intakes from formula reconstituted with contaminated water to calculate overall PFAS serum curves for each scenario
Body weights (kg) were calculated from total water ingestion data presented in Table 3-5 (i.e., mL/day ÷ mL/kg-day):
Mean intake
Age group Body weight (kg)
< 1 month 3.5
1 to < 3 months 4.6
3 to < 6 months 6.9
6 to < 12 months 8.9
95th percentile intake
Age group Body weight (kg)
< 1 month 3.6
1 to < 3 months 3.8
3 to < 6 months 7.0
6 to < 12 months 8.9