
Page 42 - Read Online
P. 42
Page 4 of 13 Bogdan et al. J Environ Expo Assess 2024;3:14 https://dx.doi.org/10.20517/jeea.2024.08
tubes. The tubes were mixed, stored overnight in a -20C freezer, centrifuged, and an aliquot of supernatant
was quantitatively transferred to 96-well plates for concentration via gentle nitrogen. After concentration,
the sample was analyzed by LC/MS/MS (Shimadzu Prominence, AB Sciex 5500Q) using electrospray
ionization with multiple reaction monitoring (MRM) and retention time windows. Bovine whole milk was
used to prepare matrix-matched calibration curves and quantitation was performed via isotope dilution. A
minimum of 2 MRM transitions were monitored for each analyte, and unknowns were verified through
retention time and ion ratio matching with the calibration curve. A minimum of three quality control (QC)
samples were run with each batch of 17 unknowns: a method blank, and low and high concentration levels.
The QC materials were prepared in bovine dairy milk (method blank) and fortified human milk. Batches
with QC recovery outside of 70%-130% are reanalyzed.
The data are reported as continuous variables from the limit of quantitation (LOQ) up to 5,000 ng/L. Ten
PFAS analytes were included in this method [Table 1].
During the development of the analytical method, perfluorobutanoic acid (PFBA), perfluoropentanoic acid
(PFPeA), and perfluorododecanoic acid (PFDoA) were also included, but all three had irresolvable technical
difficulties. PFBA and PFPeA had interfering coeluates, and PFDoA had a very poor recovery. Therefore,
these were not included in the final analysis.
Calculating PFAS concentrations in infant formula powder
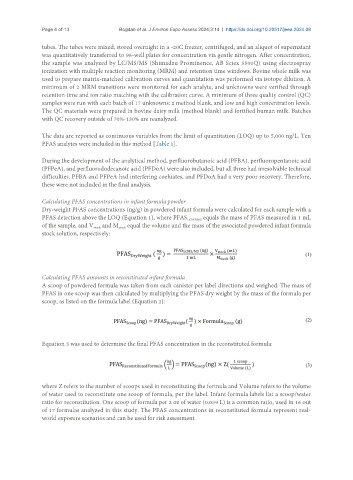
Dry-weight PFAS concentrations (ng/g) in powdered infant formula were calculated for each sample with a
PFAS detection above the LOQ (Equation 1), where PFAS LCMS/MS equals the mass of PFAS measured in 1 mL
of the sample, and V and M equal the volume and the mass of the associated powdered infant formula
stock
stock
stock solution, respectively:
Calculating PFAS amounts in reconstituted infant formula
A scoop of powdered formula was taken from each canister per label directions and weighed. The mass of
PFAS in one scoop was then calculated by multiplying the PFAS dry weight by the mass of the formula per
scoop, as listed on the formula label (Equation 2):
Equation 3 was used to determine the final PFAS concentration in the reconstituted formula:
where Z refers to the number of scoops used in reconstituting the formula and Volume refers to the volume
of water used to reconstitute one scoop of formula, per the label. Infant formula labels list a scoop/water
ratio for reconstitution. One scoop of formula per 2 oz of water (0.059 L) is a common ratio, used in 16 out
of 17 formulas analyzed in this study. The PFAS concentrations in reconstituted formula represent real-
world exposure scenarios and can be used for risk assessment.