
Page 46 - Read Online
P. 46
Page 8 of 13 Bogdan et al. J Environ Expo Assess 2024;3:14 https://dx.doi.org/10.20517/jeea.2024.08
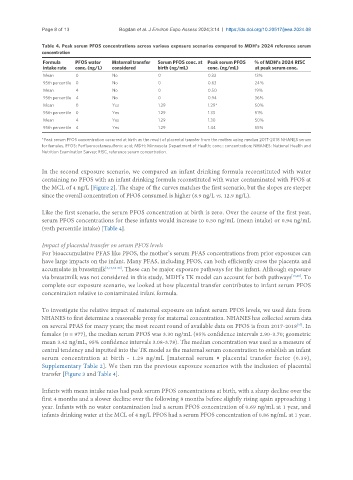
Table 4. Peak serum PFOS concentrations across various exposure scenarios compared to MDH’s 2024 reference serum
concentration
Formula PFOS water Maternal transfer Serum PFOS conc. at Peak serum PFOS % of MDH’s 2024 RfSC
intake rate conc. (ng/L) considered birth (ng/mL) conc. (ng/mL) at peak serum conc.
Mean 0 No 0 0.33 13%
95th percentile 0 No 0 0.63 24%
Mean 4 No 0 0.50 19%
95th percentile 4 No 0 0.94 36%
Mean 0 Yes 1.29 1.29* 50%
95th percentile 0 Yes 1.29 1.33 51%
Mean 4 Yes 1.29 1.30 50%
95th percentile 4 Yes 1.29 1.44 55%
*Peak serum PFOS concentration occurred at birth as the result of placental transfer from the mother using median 2017-2018 NHANES serum
for females. PFOS: Perfluorooctanesulfonic acid; MDH: Minnesota Department of Health; conc.: concentration; NHANES: National Health and
Nutrition Examination Survey; RfSC, reference serum concentration.
In the second exposure scenario, we compared an infant drinking formula reconstituted with water
containing no PFOS with an infant drinking formula reconstituted with water contaminated with PFOS at
the MCL of 4 ng/L [Figure 2]. The shape of the curves matches the first scenario, but the slopes are steeper
since the overall concentration of PFOS consumed is higher (8.9 ng/L vs. 12.9 ng/L).
Like the first scenario, the serum PFOS concentration at birth is zero. Over the course of the first year,
serum PFOS concentrations for these infants would increase to 0.50 ng/mL (mean intake) or 0.94 ng/mL
(95th percentile intake) [Table 4].
Impact of placental transfer on serum PFOS levels
For bioaccumulative PFAS like PFOS, the mother’s serum PFAS concentrations from prior exposures can
have large impacts on the infant. Many PFAS, including PFOS, can both efficiently cross the placenta and
accumulate in breastmilk [6,15,34-36] . These can be major exposure pathways for the infant. Although exposure
via breastmilk was not considered in this study, MDH’s TK model can account for both pathways [15,20] . To
complete our exposure scenario, we looked at how placental transfer contributes to infant serum PFOS
concentration relative to contaminated infant formula.
To investigate the relative impact of maternal exposure on infant serum PFOS levels, we used data from
NHANES to first determine a reasonable proxy for maternal concentration. NHANES has collected serum data
on several PFAS for many years; the most recent round of available data on PFOS is from 2017-2018 . In
[37]
females (n = 977), the median serum PFOS was 3.30 ng/mL (95% confidence intervals 2.90-3.70; geometric
mean 3.42 ng/mL, 95% confidence intervals 3.08-3.78). The median concentration was used as a measure of
central tendency and inputted into the TK model as the maternal serum concentration to establish an infant
serum concentration at birth - 1.29 ng/mL [maternal serum × placental transfer factor (0.39),
Supplementary Table 2]. We then ran the previous exposure scenarios with the inclusion of placental
transfer [Figure 3 and Table 4].
Infants with mean intake rates had peak serum PFOS concentrations at birth, with a sharp decline over the
first 4 months and a slower decline over the following 8 months before slightly rising again approaching 1
year. Infants with no water contamination had a serum PFOS concentration of 0.69 ng/mL at 1 year, and
infants drinking water at the MCL of 4 ng/L PFOS had a serum PFOS concentration of 0.86 ng/mL at 1 year.