
Page 18 - Read Online
P. 18
Page 12 of 17 Hammel et al. J Environ Expo Assess 2024;3:8 https://dx.doi.org/10.20517/jeea.2023.51
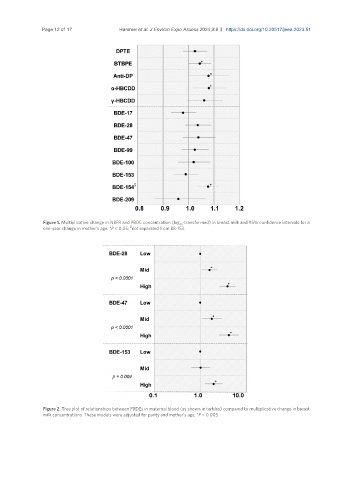
Figure 1. Multiplicative change in NBFR and PBDE concentration (log -transformed) in breast milk and 95% confidence intervals for a
10
$
one-year change in mother’s age. *P < 0.05; not separated from BB-153.
Figure 2. Tree plot of relationships between PBDEs in maternal blood (as shown in tertiles) compared to multiplicative change in breast
milk concentrations. These models were adjusted for parity and mother’s age. *P < 0.005.