
Page 180 - Read Online
P. 180
Liu et al. Th17 activation by H. pylori and triglyceride
associated with H. pylori infection in human HC. with IL-17A expression was established [Figure 3D].
Indeed, higher levels of gastric GM-CSF were seen
in H. pylori-positive vs. negative tumors [Figure 3A]. H. pylori induces tumor progression and
Further, we observed that H. pylori-induced GM-CSF RORγt expression
expression was closely associated with enhanced IL- In agreement with previous reports, [28,29] we
17A expression [Figure 3B]. Our results suggest that observed that H. pylori infection was related to
H. pylori infection may activate Th17 responses as tumor progression, as H. pylori-associated tumors
evidenced by the induced expression of IL-17A and were usually more aggressive than the tumors from
GM-CSF. uninfected individuals. Tumors larger than 4 cm were
seen in 67% of H. pylori-infected patients but only in
CXCL1 has been demonstrated to be secreted by 44% of uninfected patients [Figure 4A]. Consistently,
inflamed stomach and adipose associated with H. approximately 80% H. pylori-associated tumors
pylori infection, acting as a potent mobilizer of advanced to T3/T4 stages, whereas 69% of tumors of
[19]
bone marrow-derived IMCs. Consistently, our present
results showed that the expression of CXCL1 was
significantly increased in H. pylori-positive vs. negative
patients [Figure 3C], and a close correlation of CXCL1
Table 1: The primers used in RT-qPCR
Target gene Primer sequence (5’ to 3’)
AGACAGCCACTCACCTCTTC
IL-6 TTTCACCAGGCAAGTCTCCT
AATCTCCACCGCAATGAGGA
IL-17A ACCAGTATCTTCTCCAGCCG
TCACAGTGTGTGGTCAACAT
CXCL1 AGCCCCTTTGTTCTAAGCCA
ATTCTACAAGCCCAGCCCAG
GM-CSF CCCTCCTTGGCTGAACAGAG
GAAGCAATCAATCAAGAACC
CagA
GACTCCCCATTAACACAGAA
CGGTATCAATCTGTCCAATC
VacA AATTCACAAATCTTCCCAAA
GCGTGACATTAACCACAAGC
β-actin
CCACGTCACACTTCATGATGG
RT-qPCR: reverse transcription quantitative polymerase chain
reaction; IL: interleukin; CXCL1: chemokine (C-X-C motif) ligand 1;
GM-CSF: granulocyte-macrophage colony-stimulating factor
Table 2: Altered glycolipid metabolic factors and H.
pylori infection
HP (+) HP (-) P value
GLU
High 6 14 0.53
Normal 9 13
CHO
High 7 10 0.74
Normal 8 17
LDL
High 10 18 0.74
Normal 5 7
HDL
Low 1 3 1
Normal 14 22
TG
High 7 8 0.32
Normal 8 19
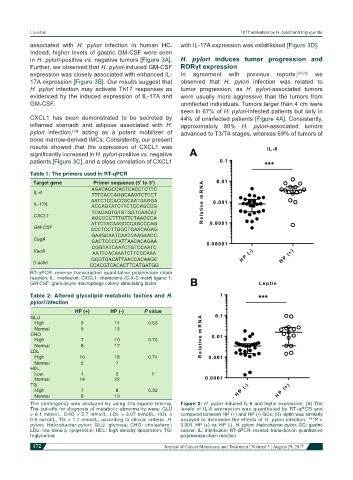
The contingency was analyzed by using Chi-square testing. Figure 2: H. pylori induced IL-6 and leptin expression. (A) The
The cut-offs for diagnosis of metabolic abnormality were: GLU levels of IL-6 expression was quantitated by RT-qPCR and
> 6.1 mmol/L, CHO > 5.7 mmol/L, LDL > 3.07 mmol/L, HDL < compared between HP (+) and HP (-) GCs; (B) leptin was similarly
0.9 mmol/L, TG > 1.7 mmol/L, according to clinical criteria. H. assayed to determine the effects of H. pylori infection. ***P <
pylori: Helicobacter pylori; GLU: glucose; CHO: cholesterol; 0.001, HP (+) vs. HP (-). H. pylori: Helicobacter pylori; GC: gastric
LDL: low density lipoprotein; HDL: high density lipoprotein; TG: cancer; IL: interleukin; RT-qPCR: reverse transcription quantitative
triglyceride polymerase chain reaction
172 Journal of Cancer Metastasis and Treatment ¦ Volume 3 ¦ August 29, 2017