
Page 448 - Read Online
P. 448
Dave et al. Nibrin expression in OSCC
histoscore (H-score) method to combine the staining values ≤ 0.05 were considered significant.
intensity and percentage of Nibrin expressing cells.
More specifically, the staining intensity was assessed RESULTS
with a four-point scale from negative (0); weak (1);
moderate (2); and strong intensity (3). The extent of Nibrin expression in OSCC
the staining was expressed as percentage of positive Of the tongue and buccal mucosa cancer tissue,
cells (0-100%) by 10% intervals. The Nibrin histoscore Nibrin protein expression was evaluated with nuclear
was counted by multiplying the intensity level by location of the immunoreactions, Nibrin was expressed
percentage of positive cells resulting in a value between in 99% of tumors and 92% of the adjacent normal
0 and 300. Data were divided into groups by histoscore squamous epithelium [Figure 1]. H-score varied from
levels. Accordingly the cancer and their corresponding 0 to 300 in both OSCC and adjacent normal tissues.
adjacent normal specimens were grouped by Nibrin Median H-score for tumor tissues was 210 while that
expression score based on the median score value of for the adjacent normal tissue was 145. The tissues
cancerous and adjacent normal tissues respectively expressing Nibrin below the median H-score was
into “weak expression” (Tumor: scores 0-209 and consider as a weak expression and tissue expressing
Normal: scores 0-144) and “strong expression” (Tumor: Nibrin above the median H-score was considered as a
scores 210-300 and Normal: scores 145-300). strong expression.
Follow-up and disease status of OSCC patients Relation of Nibrin expression with clinical and
Out of total 100 OSCC patients, for overall survival histopathological parameters
analysis, only 90 patients could be followed for a Two tailed chi-square test and spearman’s correlation
period of 24 months or until death within that period. coefficient (r) were used to assess correlation between
On the other hand, for relapse-free survival study, 78 the Nibrin protein expression and clinicopathological
of 100 patients with or without recurrence within that parameters in tumor tissues. The relations of Nibrin
period were considered. The remaining 12 patients immunoreactivity with clinical and histopathological
could not be included for relapse-free survival study parameters are depicted in Table 1, respectively. In
due to presence of persistent disease. tumor tissues an inverse correlation of Nibrin expression
was found with tumor size (χ = 5.622, r = -0.237, P =
2
Statistical analysis 0.018) and tumor stage (χ = 6.600, r = -0.194, P =
2
The data were analyzed statistically using SPSS 0.039) while, significant positive correlation was found
software version 17.0 (Chicago, IL, USA). The two with strong Nibrin expression and moderately/poorly
tailed chi-square test was used to assess associations differentiated tumor tissues (χ = 4.857, r = +0.220,
2
between two parameters. Correlations between P = 0.028). No significant association was detected
two parameters were calculated using spearman’s with Nibrin expression and other clinicopathological
correlation coefficient (r). To compare the Nibrin parameters.
expression in cancerous and adjacent normal tissues,
paired sample t-test was used. Univariate survival Univariate survival analysis
analysis was performed using Kaplan-Meier survival According to Kaplan-Meier survival analysis similar
function and differences in survival were tested for incidence of death observed in total patients with
statistical significance using the log-rank statistics. P strong (42%, 20/48, log-rank = 0.112, df = 1, P = 0.737)
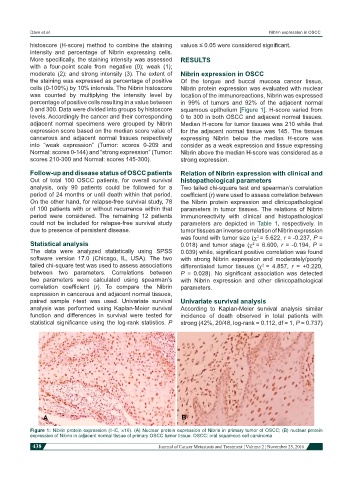
Figure 1: Nibrin protein expression (IHC, ×10). (A) Nuclear protein expression of Nibrin in primary tumor of OSCC; (B) nuclear protein
expression of Nibrin in adjacent normal tissue of primary OSCC tumor tissue. OSCC: oral squamous cell carcinoma
438 Journal of Cancer Metastasis and Treatment ¦ Volume 2 ¦ November 25, 2016