
Page 283 - Read Online
P. 283
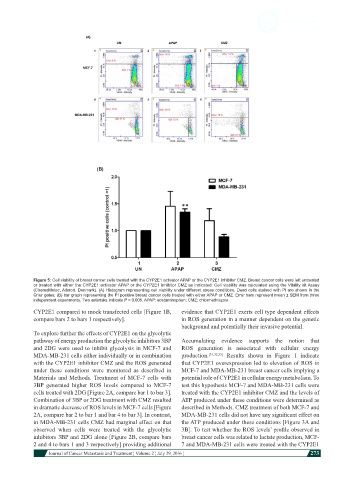
Figure 5: Cell viability of breast cancer cells treated with the CYP2E1 activator APAP or the CYP2E1 inhibitor CMZ. Breast cancer cells were left untreated
            or treated with either the CYP2E1 activator APAP or the CYP2E1 inhibitor CMZ as indicated. Cell viability was calculated using the Vitality kit Assay
            (ChemoMetec, Allerod, Denmark). (A) Histogram representing cell viability under different stress conditions. Dead cells stained with PI are shown in the
            Q1ur gates; (B) bar graph representing the PI positive breast cancer cells treated with either APAP or CMZ. Error bars represent mean ± SEM from three
            independent experiments. Two asterisks indicate P < 0.005. APAP: acetaminophen; CMZ: chlormethiazole
            CYP2E1 compared to mock transfected cells [Figure 1B,   evidence that CYP2E1 exerts cell type dependent effects
            compare bars 2 to bars 1 respectively].           in ROS generation in a manner dependent on the genetic
                                                              background and potentially their invasive potential.
            To explore further the effects of CYP2E1 on the glycolytic
            pathway of energy production the glycolytic inhibitors 3BP   Accumulating  evidence  supports the notion that
            and 2DG were used to inhibit glycolysis in MCF-7 and   ROS generation  is associated  with cellular  energy
            MDA-MB-231 cells either individually or in combination   production. [31,32,35]  Results shown in Figure 1 indicate
            with the CYP2E1 inhibitor CMZ and the ROS generated   that CYP2E1 overexpression led to elevation of ROS in
            under these conditions were monitored as described in   MCF-7 and MDA-MB-231 breast cancer cells implying a
            Materials and Methods. Treatment  of MCF-7 cells with   potential role of CYP2E1 in cellular energy metabolism. To
            3BP generated higher ROS  levels compared to MCF-7   test this hypothesis MCF-7 and MDA-MB-231 cells were
            cells treated with 2DG [Figure 2A, compare bar 1 to bar 3].   treated with the CYP2E1 inhibitor CMZ and the levels of
            Combination of 3BP or 2DG treatment with CMZ resulted   ATP produced under these conditions were determined as
            in dramatic decrease of ROS levels in MCF-7 cells [Figure   described in Methods. CMZ treatment of both MCF-7 and
            2A, compare bar 2 to bar 1 and bar 4 to bar 3]. In contrast,   MDA-MB-231 cells did not have any significant effect on
            in MDA-MB-231 cells CMZ had marginal effect on that   the ATP produced under these conditions [Figure 3A and
            observed when cells  were treated  with the  glycolytic   3B]. To test whether the ROS levels’ profile observed in
            inhibitors 3BP and 2DG alone [Figure 2B, compare bars   breast cancer cells was related to lactate production, MCF-
            2 and 4 to bars 1 and 3 respectively] providing additional   7 and MDA-MB-231 cells were treated with the CYP2E1
                         Journal of Cancer Metastasis and Treatment ¦ Volume 2 ¦ July 29, 2016 ¦          273