
Page 280 - Read Online
P. 280
(Lonza, Slough, UK), based on the bioluminescent Media was collected in a 96 well plates after treatment. Two
measurement of ATP present in cells. ATP monitoring microlitre of this media was mixed with 60 µL of lactate
reagent (AMR plus) was prepared by adding assay buffer reagent and incubated at room temperature for 15 min
into the vial containing the lyophilized AMR and incubated and the absorbance was recorded at 540 nm. Lactic acid
at room temperature for 15 min for complete rehydration. standard solutions (Trinity Biotech, Ireland) were used to
Cells were lysed in 50 μL of cell lysis reagent for 10 min. plot the standard curve and the concentration of lactic acid
A total volume of 100 μL of cell lysate was added to a present in the media was calculated accordingly. Lactate
luminometer plate and 100 μL of AMR plus was added to production rates were expressed as mmol/L.
the appropriate well. The plate was then incubated at room
temperature for 2 min and values were obtained from the Mitochondrial membrane potential
luminometer. Mitochondrial transmembrane potential (Δψm)
was measured using the cationic dye JC- 1 (5, 5, 6,
Lactate assay 6-tetrachloro-1,1,3,3-tetraethylbenzimidazolcarbocyanine
To measure the lactate efflux MCF-7 and MDA-MB-231 iodide) (ChemoMetec, Allerod, Denmark) using the
breast cancer cells were grown in 6 well plates and left NucleoCounter NC-3000™ system. Cells were grown in
®
untreated or treated with CYP2E1 specific inhibitor CMZ. 6-well plates and treated with the CYP2E1 activator APAP
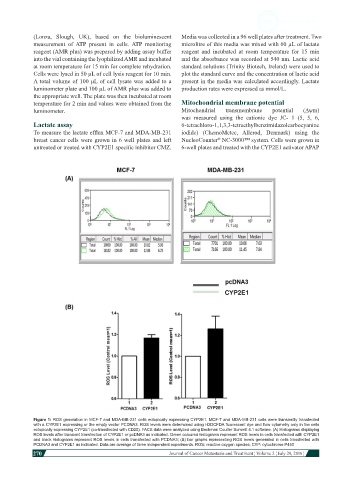
Figure 1: ROS generation in MCF-7 and MDA-MB-231 cells ectopically expressing CYP2E1. MCF-7 and MDA-MB-231 cells were transiently transfected
with a CYP2E1 expressing or the empty vector PCDNA3. ROS levels were determined using H2DCFDA fluorescent dye and flow cytometry only in the cells
ectopically expressing CYP2E1 (co-transfected with CD20). FACS data were analyzed using Beckman Coulter Summit 4.1 software. (A) Histograms displaying
ROS levels after transient transfection of CYP2E1 or pcDNA3 as indicated. Green coloured histograms represent ROS levels in cells transfected with CYP2E1
and black histograms represent ROS levels in cells transfected with PCDNA3; (B) bar graphs representing ROS levels generated in cells transfected with
PCDNA3 and CYP2E1 as indicated. Data are average of three independent experiments. ROS: reactive oxygen species; CYP: cytochrome P450
270
Journal of Cancer Metastasis and Treatment ¦ Volume 2 ¦ July 29, 2016 ¦