
Page 281 - Read Online
P. 281
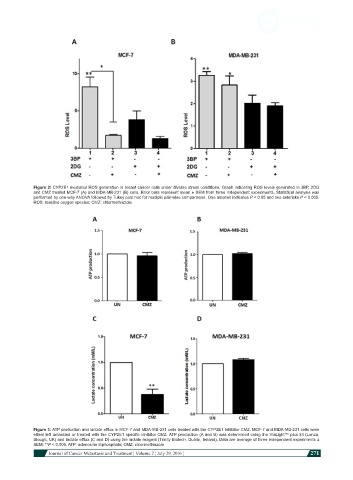
Figure 2: CYP2E1 mediated ROS generation in breast cancer cells under diverse stress conditions. Graph indicating ROS levels generated in 3BP, 2DG
            and CMZ treated MCF-7 (A) and MDA-MB-231 (B) cells. Error bars represent mean ± SEM from three independent experiments. Statistical analysis was
            performed by one-way ANOVA followed by Tukey post hoc for multiple pair-wise comparisons. One asterisk indicates P < 0.05 and two asterisks P < 0.005.
            ROS: reactive oxygen species; CMZ: chlormethiazole


            Figure 3: ATP production and lactate efflux in MCF-7 and MDA-MB-231 cells treated with the CYP2E1 inhibitor CMZ. MCF-7 and MDA-MB-231 cells were
            either left untreated or treated with the CYP2E1 specific inhibitor CMZ. ATP production (A and B) was determined using the ViaLight™ plus kit (Lonza,
            Slough, UK) and lactate efflux (C and D) using the lactate reagent (Trinity Biotech, Dublin, Ireland). Data are average of three independent experiments ±
            SEM; **P < 0.005. ATP: adenosine triphosphate; CMZ: chlormethiazole
                         Journal of Cancer Metastasis and Treatment ¦ Volume 2 ¦ July 29, 2016 ¦          271