
Page 145 - Read Online
P. 145
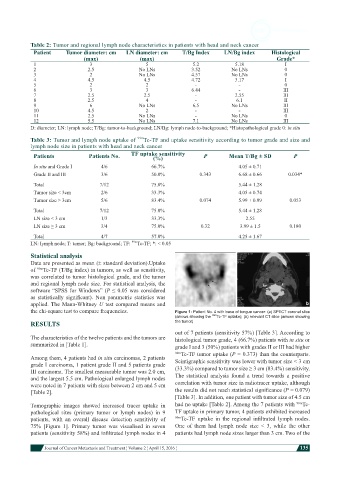
Table 2: Tumor and regional lymph node characteristics in patients with head and neck cancer
             Patient    Tumor diameter: cm   LN diameter: cm     T/Bg Index     LN/Bg index     Histological
                              (max)               (max)                                           Grade*
             1                   3                  5                5.2            5.18             I
             2                  2.5               No LNs            3.52          No LNs             0
             3                   2                No LNs            4.57          No LNs             0
             4                  4.5                 4.5             4.72            3.17             I
             5                   2                  2                 -              -               0
             6                   3                  3               6.44             -               III
             7                  2.5                 2.5               -             2.55             III
             8                  2.5                 4                 -             6.1              II
             9                   6                No LNs             6.5          No LNs             III
             10                 4.5                 2                 -              -               III
             11                 2.5               No LNs              -           No LNs             0
             12                 5.5               No LNs             7.1          No LNs             III
            D: diameter; LN: lymph node; T/Bg: tumor-to-background; LN/Bg: lymph node-to-background; *Histopathological grade 0: in situ

            Table 3: Tumor and lymph node uptake of  99m Tc-TF and uptake sensitivity according to tumor grade and size and
            lymph node size in patients with head and neck cancer
             Patients           Patients No.   TF uptake sensitivity     P       Mean T/Bg ± SD         P
                                                       (%)
             In situ and Grade I     4/6              66.7%                          4.05 ± 0.71
             Grade II and III        3/6              50.0%            0.343         6.68 ± 0.66      0.034*

             Total                  7/12              75.0%                          5.44 ± 1.28
             Tumor size < 3cm        2/6              33.3%                          4.05 ± 0.74
             Tumor size ≥ 3cm        5/6              83.4%            0.074         5.99 ± 0.99       0.053
             Total                  7/12              75.0%                          5.44 ± 1.28
             LN size < 3 cm          1/3              33.3%                            2.55
             LN size ≥ 3 cm          3/4              75.0%             0.32         3.99 ± 1.5        0.180
             Total                   4/7              57.0%                          4.25 ± 1.67
            LN: lymph node; T: tumor; Bg: background; TF:  99m Tc-TF; *: < 0.05
            Statistical analysis
            Data are presented as mean (± standard deviation).Uptake
            of  99m Tc-TF (T/Bg index) in tumors, as well as sensitivity,
            was correlated to tumor histological grade, and the tumor
            and regional lymph node size. For statistical analysis, the
            software “SPSS for Windows” (P ≤ 0.05 was considered
            as  statistically  significant).  Non  parametric  statistics  was
            applied. The Mann-Whitney U test compared means and
            the chi-square test to compare frequencies.        Figure 1: Patient No. 4 with base of tongue cancer: (a) SPECT coronal slice
                                                               (arrows showing the   99m Tc-TF uptake); (b) relevant CT slice (arrows showing
            RESULTS                                            the tumor)
                                                               out of 7 patients (sensitivity 57%) [Table 3]. According to
            The characteristics of the twelve patients and the tumors are   histological tumor grade, 4 (66.7%) patients with in situ or
            summarized in [Table 1].                           grade I and 3 (50%) patients with grades II or III had higher
                                                               99m Tc-TF tumor uptake (P = 0.373) than the counterparts.
            Among them, 4 patients had in situ carcinomas, 2 patients   Scintigraphic sensitivity was lower with tumor size < 3 cm
            grade I carcinoma, 1 patient grade II and 5 patients grade   (33.3%) compared to tumor size ≥ 3 cm (83.4%) sensitivity.
            III carcinoma. The smallest measurable tumor was 2.0 cm,
            and the largest 5.5 cm. Pathological enlarged lymph nodes   The  statistical  analysis  found  a  trend  towards  a  positive
            were noted in 7 patients with sizes between 2 cm and 5 cm   correlation with tumor size in radiotracer uptake, although
            [Table 2].                                         the results did not reach statistical significance (P = 0.079)
                                                               [Table 3]. In addition, one patient with tumor size of 4.5 cm
            Tomographic  images showed increased  tracer  uptake in   had no uptake [Table 2]. Among the 7 patients with  99m Tc-
            pathological  sites (primary tumor or lymph nodes) in 9   TF uptake in primary tumor, 4 patients exhibited increased
            patients, with an overall disease detection  sensitivity of   99m Tc-TF  uptake  in  the  regional  infiltrated  lymph  nodes.
            75% [Figure 1]. Primary  tumor was visualised  in seven   One of them  had lymph  node size  < 3, while  the other
            patients (sensitivity 58%) and infiltrated lymph nodes in 4   patients had lymph node sizes larger than 3 cm. Two of the


                        Journal of Cancer Metastasis and Treatment ¦ Volume 2 ¦ April 15, 2016 ¦          135