
Page 33 - Read Online
P. 33
Udukala et al. J Cancer Metastasis Treat 2020;6:25 I http://dx.doi.org/10.20517/2394-4722.2020.45 Page 7 of 13
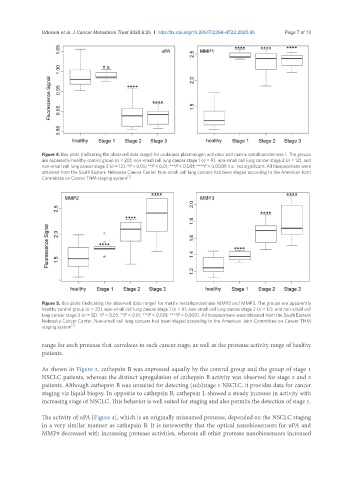
Figure 4. Box plots (indicating the observed data range) for urokinase plasminogen activator and matrix metalloproteinase 1. The groups
are apparently healthy control group (n = 20), non-small cell lung cancer stage 1 (n = 9), non-small cell lung cancer stage 2 (n = 12), and
non-small cell lung cancer stage 3 (n = 12). *P < 0.05; **P < 0.01; ***P < 0.001; ****P < 0.0001; n.s.: not significant. All biospecimens were
obtained from the South Eastern Nebraska Cancer Center. Non-small cell lung cancers had been staged according to the American Joint
Committee on Cancer TNM staging system [2]
Figure 5. Box plots (indicating the observed data range) for matrix metalloproteinase MMP2 and MMP3. The groups are apparently
healthy control group (n = 20), non-small cell lung cancer stage 1 (n = 9), non-small cell lung cancer stage 2 (n = 12), and non-small cell
lung cancer stage 3 (n = 12). *P < 0.05; **P < 0.01; ***P < 0.001; ****P < 0.0001. All biospecimens were obtained from the South Eastern
Nebraska Cancer Center. Non-small cell lung cancers had been staged according to the American Joint Committee on Cancer TNM
staging system [2]
range for each protease that correlates to each cancer stage, as well as the protease activity range of healthy
patients.
As shown in Figure 3, cathepsin B was expressed equally by the control group and the group of stage 1
NSCLC patients, whereas the distinct upregulation of cathepsin B activity was observed for stage 2 and 3
patients. Although cathepsin B was unsuited for detecting (sub)stage 1 NSCLC, it provides data for cancer
staging via liquid biopsy. In opposite to cathepsin B, cathepsin L showed a steady increase in activity with
increasing stage of NSCLC. This behavior is well suited for staging and also permits the detection of stage 1.
The activity of uPA [Figure 4], which is an originally misnamed protease, depended on the NSCLC staging
in a very similar manner as cathepsin B. It is noteworthy that the optical nanobiosensors for uPA and
MMP9 decreased with increasing protease activities, whereas all other protease nanobiosensors increased