
Page 36 - Read Online
P. 36
Page 10 of 13 Udukala et al. J Cancer Metastasis Treat 2020;6:25 I http://dx.doi.org/10.20517/2394-4722.2020.45
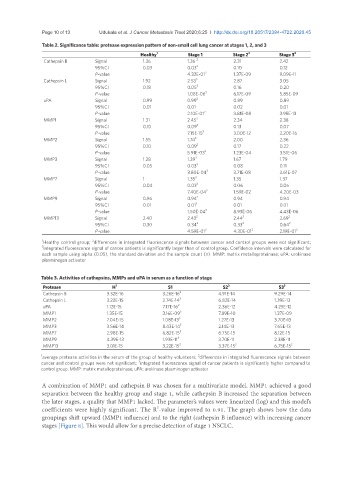
Table 2. Significance table: protease expression pattern of non-small cell lung cancer at stages 1, 2, and 3
Healthy 1 Stage 1 Stage 2 3 Stage 3 3
Cathepsin B Signal 1.36 1.36 2 2.31 2.42
95%CI 0.03 0.03 2 0.10 0.12
P-value 4.32E-01 2 1.37E-09 9.09E-11
Cathepsin L Signal 1.92 2.53 3 2.87 3.05
95%CI 0.18 0.05 3 0.16 0.20
P-value 1.08E-06 3 6.17E-09 5.85E-09
uPA Signal 0.99 0.99 2 0.89 0.89
95%CI 0.01 0.01 0.02 0.01
P-value 2.10E-01 2 3.81E-08 3.95E-13
MMP1 Signal 1.31 2.45 3 2.34 2.38
95%CI 0.10 0.09 3 0.13 0.07
P-value 7.15E-15 3 3.00E-12 2.20E-16
MMP2 Signal 1.55 1.74 3 2.00 2.36
95%CI 0.10 0.09 3 0.17 0.22
P-value 5.91E-03 3 1.23E-04 3.51E-06
MMP3 Signal 1.28 1.39 3 1.67 1.79
95%CI 0.05 0.03 3 0.08 0.11
P-value 3.80E-04 3 3.71E-08 2.61E-07
MMP7 Signal 1 1.35 3 1.35 1.37
95%CI 0.04 0.03 3 0.06 0.06
P-value 7.40E-04 3 1.59E-02 4.20E-03
MMP9 Signal 0.96 0.94 3 0.94 0.94
95%CI 0.01 0.01 3 0.01 0.01
P-value 1.50E-04 3 8.93E-06 4.43E-06
MMP13 Signal 2.40 2.43 2 2.44 2 2.69 2
95%CI 0.30 0.34 2 0.33 2 0.64 2
P-value 4.59E-01 2 4.30E-01 2 2.19E-01 2
1 2
Healthy control group; differences in integrated fluorescence signals between cancer and control groups were not significant;
3
integrated fluorescence signal of cancer patients is significantly larger than of control group. Confidence intervals were calculated for
each sample using alpha (0.05), the standard deviation and the sample count (n). MMP: matrix metalloproteinase; uPA: urokinase
plasminogen activator
Table 3. Activities of cathepsins, MMPs and uPA in serum as a function of stage
Protease H 1 S1 S2 3 S3 3
Cathepsin B 3.32E-16 3.26E-16 2 4.91E-14 9.29E-14
Cathepsin L 3.22E-15 2.74E-14 3 6.82E-14 1.39E-13
uPA 1.12E-15 7.17E-16 2 2.36E-12 4.25E-12
MMP1 1.35E-15 3.16E-09 3 7.89E-10 1.37E-09
MMP2 7.04E-15 1.08E-13 3 1.27E-13 3.70E-13
MMP3 3.56E-14 8.43E-14 3 2.14E-13 7.65E-13
MMP7 2.98E-15 6.82E-15 3 6.75E-15 8.12E-15
MMP9 4.39E-13 1.93E-11 3 3.70E-11 2.38E-11
MMP13 3.01E-15 3.22E-15 2 3.37E-15 2 6.75E-15 2
2
1 average protease activities in the serum of the group of healthy volunteers; differences in integrated fluorescence signals between
3
cancer and control groups were not significant; integrated fluorescence signal of cancer patients is significantly higher compared to
control group. MMP: matrix metalloproteinase; uPA: urokinase plasminogen activator
A combination of MMP1 and cathepsin B was chosen for a multivariate model. MMP1 achieved a good
separation between the healthy group and stage 1, while cathepsin B increased the separation between
the later stages, a quality that MMP1 lacked. The parameter’s values were linearized (log) and this model’s
2
coefficients were highly significant. The R -value improved to 0.91. The graph shows how the data
groupings shift upward (MMP1 influence) and to the right (cathepsin B influence) with increasing cancer
stages [Figure 8]. This would allow for a precise detection of stage 1 NSCLC.