
Page 32 - Read Online
P. 32
Page 6 of 13 Udukala et al. J Cancer Metastasis Treat 2020;6:25 I http://dx.doi.org/10.20517/2394-4722.2020.45
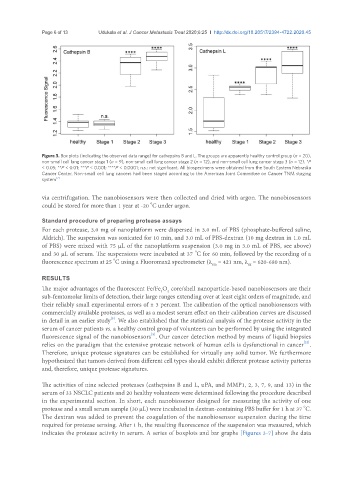
Figure 3. Box plots (indicating the observed data range) for cathepsins B and L. The groups are apparently healthy control group (n = 20),
non-small cell lung cancer stage 1 (n = 9), non-small cell lung cancer stage 2 (n = 12), and non-small cell lung cancer stage 3 (n = 12). *P
< 0.05; **P < 0.01; ***P < 0.001; ****P < 0.0001; n.s.: not significant. All biospecimens were obtained from the South Eastern Nebraska
Cancer Center. Non-small cell lung cancers had been staged according to the American Joint Committee on Cancer TNM staging
system [2]
via centrifugation. The nanobiosensors were then collected and dried with argon. The nanobiosensors
o
could be stored for more than 1 year at -20 C under argon.
Standard procedure of preparing protease assays
For each protease, 3.0 mg of nanoplatform were dispersed in 3.0 mL of PBS (phosphate-buffered saline,
Aldrich). The suspension was sonicated for 10 min, and 3.0 mL of PBS-dextran (10 mg dextran in 1.0 mL
of PBS) were mixed with 75 μL of the nanoplatform suspension (3.0 mg in 3.0 mL of PBS, see above)
o
and 30 μL of serum. The suspensions were incubated at 37 C for 60 min, followed by the recording of a
o
fluorescence spectrum at 25 C using a Fluoromax2 spectrometer (λ = 421 nm, λ = 620-680 nm).
ex
em
RESULTS
The major advantages of the fluorescent Fe/Fe O core/shell nanoparticle-based nanobiosensors are their
4
3
sub-femtomolar limits of detection, their large ranges extending over at least eight orders of magnitude, and
their reliably small experimental errors of ± 3 percent. The calibration of the optical nanobiosensors with
commercially available proteases, as well as a modest serum effect on their calibration curves are discussed
[5]
in detail in an earlier study . We also established that the statistical analysis of the protease activity in the
serum of cancer patients vs. a healthy control group of volunteers can be performed by using the integrated
[5]
fluorescence signal of the nanobiosensors . Our cancer detection method by means of liquid biopsies
relies on the paradigm that the extensive protease network of human cells is dysfunctional in cancer .
[22]
Therefore, unique protease signatures can be established for virtually any solid tumor. We furthermore
hypothesized that tumors derived from different cell types should exhibit different protease activity patterns
and, therefore, unique protease signatures.
The activities of nine selected proteases (cathepsins B and L, uPA, and MMP1, 2, 3, 7, 9, and 13) in the
serum of 33 NSCLC patients and 20 healthy volunteers were determined following the procedure described
in the experimental section. In short, each nanobiosenor designed for measuring the activity of one
o
protease and a small serum sample (30 μL) were incubated in dextran-containing PBS buffer for 1 h at 37 C.
The dextran was added to prevent the coagulation of the nanobiosensor suspension during the time
required for protease sensing. After 1 h, the resulting fluorescence of the suspension was measured, which
indicates the protease activity in serum. A series of boxplots and bar graphs [Figures 3-7] show the data