
Page 63 - Read Online
P. 63
Page 8 of 14 Anand et al. J Cancer Metastasis Treat 2019;5:6 I http://dx.doi.org/10.20517/2394-4722.2018.98
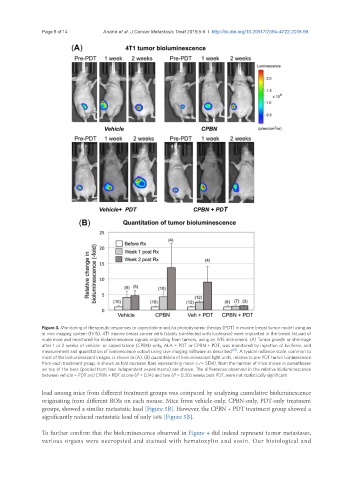
Figure 3. Monitoring of therapeutic responses to capecitabine and/or photodynamic therapy (PDT) in murine breast tumor model using an
in vivo imaging system (IVIS). 4T1 murine breast cancer cells (stably transfected with luciferase) were implanted in the breast fat pad of
nude mice and monitored for bioluminescence signals originating from tumors, using an IVIS instrument. (A) Tumor growth or shrinkage
after 1 or 2 weeks of vehicle- or capecitabine (CPBN)-only, ALA + PDT or CPBN + PDT, was monitored by injection of luciferin, and
measurement and quantitation of luminescence output using Live imaging software as described [25] . A typical radiance scale, common to
most of the bioluminescent images, is shown in (A); (B) quantitation of bioluminescent light units, relative to pre-PDT tumor luminescence
from each treatment group, is shown as fold increase. Bars representing mean (-/+ SEM), from the number of mice shown in parentheses
on top of the bars (pooled from four independent experiments) are shown. The differences observed in the relative bioluminescence
between vehicle + PDT and CPBN + PDT at one (P = 0.14) and two (P = 0.20) weeks post PDT, were not statistically significant
load among mice from different treatment groups was compared by analyzing cumulative bioluminescence
originating from different ROIs on each mouse. Mice from vehicle-only, CPBN-only, PDT-only treatment
groups, showed a similar metastatic load [Figure 5B]. However, the CPBN + PDT treatment group showed a
significantly reduced metastatic load of only 14% [Figure 5B].
To further confirm that the bioluminescence observed in Figure 4 did indeed represent tumor metastases,
various organs were necropsied and stained with hematoxylin and eosin. Our histological and