
Page 46 - Read Online
P. 46
Page 12 of 16 Tu et al. J Cancer Metastasis Treat 2018;4:58 I http://dx.doi.org/10.20517/2394-4722.2018.67
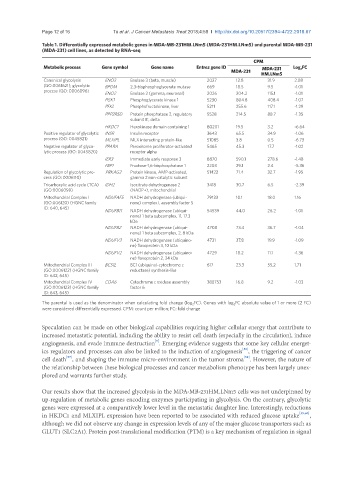
Table 1. Differentially expressed metabolic genes in MDA-MB-231HM.LNm5 (MDA-231HM.LNm5) and parental MDA-MB-231
(MDA-231) cell lines, as detected by RNA-seq
CPM
Metabolic process Gene symbol Gene name Entrez gene ID MDA-231 Log 2 FC
MDA-231 HM.LNm5
Canonical glycolysis ENO3 Enolase 3 (beta, muscle) 2027 12.8 31.9 2.08
(GO:0061621); glycolytic BPGM 2,3-bisphosphoglycerate mutase 669 18.5 9.5 -1.01
process (GO: 0006096) ENO2 Enolase 2 (gamma, neuronal) 2026 204.2 115.1 -1.01
PGK1 Phosphoglycerate kinase 1 5230 804.8 408.4 -1.07
PFKL Phosphofructokinase, liver 5211 255.6 117.1 -1.29
PPP2R5D Protein phosphatase 2, regulatory 5528 214.5 88.7 -1.35
subunit B’, delta
HKDC1 Hexokinase domain containing 1 80201 19.5 3.2 -6.64
Positive regulator of glycolytic INSR Insulin receptor 3643 65.5 34.9 -1.06
process (GO: 0045821) MLXIPL MLX interacting protein-like 51085 3.8 0.5 -6.73
Negative regulator of glyco- PPARA Peroxisome proliferator-activated 5465 45.3 17.7 -1.02
lytic process (GO: 0045820) receptor alpha
IER3 Immediate early response 3 8870 590.1 278.6 -1.48
FBP1 Fructose-1,6-bisphosphatase 1 2203 29.1 2.4 -5.36
Regulation of glycolytic pro- PRKAG2 Protein kinase, AMP-activated, 51422 71.4 32.7 -1.95
cess (GO: 0006110) gamma 2 non-catalytic subunit
Tricarboxylic acid cycle (TCA) IDH2 Isocitrate dehydrogenase 2 3418 30.7 6.5 -2.39
(GO:0006099) (NADP+), mitochondrial
Mitochondrial Complex I NDUFAF5 NADH dehydrogenase (ubiqui- 79133 10.1 18.0 1.16
(GO:006120) (HGNC family none) complex I, assembly factor 5
ID: 640, 645)
NDUFB11 NADH dehydrogenase (ubiqui- 54539 44.0 26.2 -1.01
none) 1 beta subcomplex, 11, 17.3
kDa
NDUFB2 NADH dehydrogenase (ubiqui- 4708 73.4 36.7 -1.04
none) 1 beta subcomplex, 2, 8 kDa
NDUFV3 NADH dehydrogenase (ubiquino- 4731 37.8 19.9 -1.09
ne) flavoprotein 3, 10 kDa
NDUFV2 NADH dehydrogenase (ubiquino- 4729 18.2 11.1 -1.36
ne) flavoprotein 2, 24 kDa
Mitochondrial Complex III BCS1L BC1 (ubiquinol-cytochrome c 617 23.3 55.2 1.71
(GO:0006122) (HGNC family reductase) synthesis-like
ID: 642, 645)
Mitochondrial Complex IV COA6 Cytochrome c oxidase assembly 388753 16.8 9.2 -1.03
(GO:0006123) (HGNC family factor 6
ID: 643, 645)
The parental is used as the denominator when calculating fold change (log 2 FC). Genes with log 2 FC absolute value of 1 or more (2 FC)
were considered differentially expressed. CPM: count per million; FC: fold change
Speculation can be made on other biological capabilities requiring higher cellular energy that contribute to
increased metastatic potential, including the ability to resist cell death (especially in the circulation), induce
[5]
angiogenesis, and evade immune destruction . Emerging evidence suggests that some key cellular energet-
[56]
ics regulators and processes can also be linked to the induction of angiogenesis , the triggering of cancer
[57]
[58]
cell death , and shaping the immune micro-environment in the tumor stroma . However, the nature of
the relationship between these biological processes and cancer metabolism phenotype has been largely unex-
plored and warrants further study.
Our results show that the increased glycolysis in the MDA-MB-231HM.LNm5 cells was not underpinned by
up-regulation of metabolic genes encoding enzymes participating in glycolysis. On the contrary, glycolytic
genes were expressed at a comparatively lower level in the metastatic daughter line. Interestingly, reductions
in HKDC1 and MLXIPL expression have been reported to be associated with reduced glucose uptake [59,60] ,
although we did not observe any change in expression levels of any of the major glucose transporters such as
GLUT1 (SLC2A1). Protein post-translational modification (PTM) is a key mechanism of regulation in signal