
Page 50 - Read Online
P. 50
Warawdekar et al. CTCs from patients with metastatic breast cancer
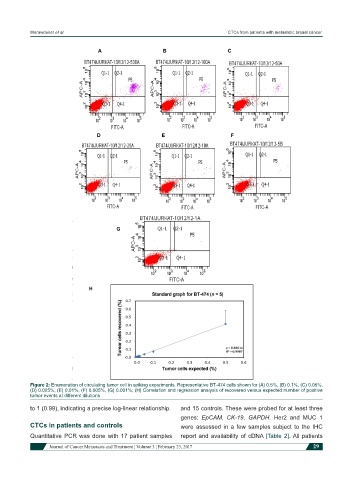
Figure 2: Enumeration of circulating tumor cell in spiking experiments. Representative BT-474 cells shown for (A) 0.5%, (B) 0.1%, (C) 0.05%,
(D) 0.025%, (E) 0.01%, (F) 0.005%, (G) 0.001%; (H) Correlation and regression analysis of recovered versus expected number of positive
tumor events at different dilutions
to 1 (0.99), indicating a precise log-linear relationship. and 15 controls. These were probed for at least three
genes: EpCAM, CK-19, GAPDH. Her2 and MUC 1
CTCs in patients and controls were assessed in a few samples subject to the IHC
Quantitative PCR was done with 17 patient samples report and availability of cDNA [Table 2]. All patients
Journal of Cancer Metastasis and Treatment ¦ Volume 3 ¦ February 23, 2017 29