Page 49 - Read Online
P. 49

Warawdekar et al.                                                                                                                                           CTCs from patients with metastatic breast cancer

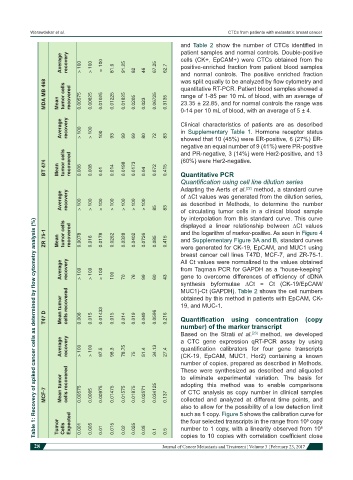
                                                              and  Table  2  show  the  number  of  CTCs  identified  in
                                                              patient samples and normal controls. Double-positive
                      Average   recovery  > 100  > 100  ≈ 100  81.6  91.25  82  46  67.25  62.7  cells (CK+, EpCAM+) were CTCs obtained  from  the
                                                              positive-enriched fraction from patient blood samples
                                                              and normal controls.  The positive enriched fraction
                MDA MB 468  Mean   tumor cells   recovered  0.00575  0.00825  0.01025  0.01225  0.01825  0.0205  0.023  0.06725  0.3135  was split equally to be analyzed by flow cytometry and
                                                              quantitative RT-PCR. Patient blood samples showed a
                                                              range of 1-85 per 10 mL of blood, with an average of
                                                              23.35 ± 22.85, and for normal controls the range was
                                                              0-14 per 10 mL of blood, with an average of 5 ± 4.

                      Average   recovery  > 100  > 100  100  93  99  69  80  72  83  Clinical  characteristics of  patients are as described
                                                              in  Supplementary  Table  1.  Hormone receptor status
                                                              showed that 10 (45%) were ER-positive, 6 (27%) ER-
                                                              negative an equal number of 9 (41%) were PR-positive
                                                              and PR-negative, 3 (14%) were Her2-positive, and 13
                BT 474  Mean   tumor cells   recovered  0.006  0.008  0.01  0.014  0.0198  0.0173  0.04  0.072  0.415  (60%) were Her2-negative.
                                                              Quantitative PCR
                                                              Quantification using cell line dilution series
                                                              Adapting the Aerts et al.  method, a standard curve
                                                                                    [22]
                      Average   recovery  > 100  > 100  > 100  > 100  > 100  > 100  > 100  85  83  of ∆Ct values was generated from the dilution series,
                                                              as  described in Methods, to  determine the  number
                                                              of circulating tumor cells in a clinical  blood  sample
                                                              by interpolation from this standard curve. This curve
             Table 1: Recovery of spiked cancer cells as determined by flow cytometry analysis (%)
                                                              displayed  a  linear  relationship  between  ∆Ct  values
                ZR 75-1  Mean   tumor cells   recovered  0.0078  0.016  0.0178  0.0262  0.0328  0.0402  0.0726  0.085  0.415  and the logarithm of marker-positive. As seen in Figure 4
                                                              and Supplementary Figure 3A and B, standard curves
                                                              were generated for CK-19, EpCAM, and MUC1 using
                                                              breast cancer cell lines T47D, MCF-7, and ZR-75-1.
                                                              All Ct values were normalized to the values obtained
                      Average   recovery  > 100  > 100  > 100  100  from Taqman PCR for GAPDH as a “house-keeping”
                                                              gene  to  overcome  differences  of  efficiency  of  cDNA
                                                      60
                                                  99
                                               76
                                                         43
                                           70
                                                              synthesis  byformulae  ∆Ct  =  Ct  (CK-19/EpCAM/
                                                              MUC1)-Ct (GAPDH). Table 2 shows the cell numbers
                      Mean tumor   cells recovered            obtained by this method in patients with EpCAM, CK-
                                                              19, and MUC-1.
                T47 D       0.006  0.015  0.01433  0.015  0.014  0.019  0.049  0.0596  0.216  Quantification  using  concentration  (copy
                                                              number) of the marker transcript
                                                              Based on the Strati  et al.  method, we developed
                                                                                      [23]
                      Average   recovery  > 100  > 100  97.5  98.3  78.75  75  51.4  34.13  27.4  a CTC gene  expression  qRT-PCR assay by using
                                                              quantification  calibrators  for  four  gene  transcripts
                                                              (CK-19, EpCAM, MUC1, Her2) containing  a known
                                                              number of copies, prepared as described in Methods.
                                                              These  were  synthesized  as described  and  aliquoted
                                                              to eliminate experimental  variation.  The basis for

                MCF-7  Mean tumor   cells recovered  0.00575  0.0065  0.00975  0.01475  0.01575  0.01875  0.02571  0.034125  0.137  adopting  this method was to enable  comparisons
                                                              of CTC analysis as copy number in clinical samples
                                                              collected  and analyzed  at different time points, and
                                                              also to allow for the possibility of a low detection limit
                                                              such as 1 copy. Figure 5 shows the calibration curve for
                     Tumor   Cells   Expected  0.001  0.005  0.01  0.015  0.02  0.025  0.05  0.1  0.5  the four selected transcripts in the range from 10  copy
                                                                                                        6
                                                              number to 1 copy, with a linearity observed from 10
                                                                                                             6
                                                              copies to 10 copies with correlation coefficient close
            28                                                                 Journal of Cancer Metastasis and Treatment ¦ Volume 3 ¦ February 23, 2017
   44   45   46   47   48   49   50   51   52   53   54