
Page 48 - Read Online
P. 48
Warawdekar et al. CTCs from patients with metastatic breast cancer
Sensitivity (ability to detect lowest number of 100%), as shown in Table 1.
epithelial tumor cells)
The assay of serial dilutions (0.001-0.5%) of human Analysis of CTCs in patients
breast tumor cells in Jurkat cells established that the To validate the use of this technique in a clinical
lower detection limit for sensitivity of the method was setting, 17 patient samples and 13 normal controls
-5
0.001% or 10 , corresponding to 1 human cell per were assessed. As described in Methods, the PBMC
100,000 Jurkat cells. Recovery and linearity were fraction was separated from peripheral blood sample
6
highly reproducible across separate experiments with an average PBMC cell count of 20.2 × 10 ± 9 ×
6
[Figure 2] and the number of tumor cell events could be 10 cells for patient samples and 23.7 × 10 ± 8.6 ×
6
6
positively correlated.Linear correlation and regression 10 cells in normal controls [Supplementary Figure 2].
analysis showed R > 0.98 for ZR-75-1, BT-474, and CTCs were enriched from the PBMC fraction using
2
MDA-MB-468 cell lines, whereas in the case of MCF-7 immunomagnetic double-positive selection for EpCAM.
2
and T-47D, R was 0.9465 and 0.9589, respectively The number of cells in the positive fraction represented
[Supplementary Figure 1]. The percentage of tumor cells that were enriched for EpCAM and, as the
cells recovered was not significantly different from the number was very low, the hemocytometer count would
percentage of tumor cells expected, based on serial not be an appropriate representation. CTCs would be
dilutions. detected in this fraction. Average cell number obtained
in the negative fraction (as described in Methods) for
Recovery the patient sample was 17.3 × 10 ± 5.7 × 10 cells
6
6
Recovery of the flow cytometry protocol was determined and in the normal control was 15.6 × 10 ± 8.03 × 10 6
6
by spiking 1-500 tumor cells in 1 × 10 Jurkat cells. The [Supplementary Figure 2 and Supplementary Table 2].
5
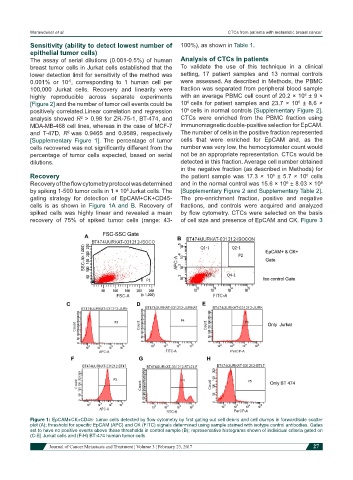
gating strategy for detection of EpCAM+CK+CD45- The pre-enrichment fraction, positive and negative
cells is as shown in Figure 1A and B. Recovery of fractions, and controls were acquired and analyzed
spiked cells was highly linear and revealed a mean by flow cytometry. CTCs were selected on the basis
recovery of 75% of spiked tumor cells (range: 43- of cell size and presence of EpCAM and CK. Figure 3
Figure 1: EpCAM+CK+CD45- tumor cells detected by flow cytometry by first gating out cell debris and cell clumps in forward/side scatter
plot (A); threshold for specific EpCAM (APC) and CK (FITC) signals determined using sample stained with isotype control antibodies. Gates
set to have no positive events above these thresholds in control sample (B); representative histograms shown of individual criteria gated on
(C-E) Jurkat cells and (F-H) BT-474 human tumor cells
Journal of Cancer Metastasis and Treatment ¦ Volume 3 ¦ February 23, 2017 27